
Net import/export registers on line side tap system
On a backfed PV installation (that is, an installation where excess solar production is fed back through a breaker on the main distribution panel to the utility) it is relatively easy to see the net import and export of power. The CTs installed on the main utility feeds are in effect net CTs, as they see power imported from and exported to the utility. Any register created using those CTs will thus change polarity when production exceeds consumption, and change back when consumption exceeds production. For instructions on displaying the net import/export values for a backfed system, see this article.
However, a line side tap PV installation (where the solar is tapped between the main utility feed CTs and the utility meter itself) only tracks the consumption of the main distribution panel by default. A register using the main utility feed CTs will only see the consumption associated with that panel, regardless of how much production is being fed back to the utility. In this case, a comparison between the main utility CTs ("Grid" register) and the production CTs ("Solar" register) can show how much power is being imported or exported.
To track this information, two formula registers must be created as follows:

Figure 1: Sample Net Import/Export register setup
Net In = min($"Solar" - $"Grid",0)
Net Out = max($"Solar" - $"Grid",0)
Note that this assumes two registers, one named "Grid" which tracks only consumption on the main distribution panel, and one name "Solar" which tracks total solar production. If needed multiple registers can be combined.
A new register will not contain any historical data. There is no way to backfill historical data into a new register.
The next step is to create a new view to display the net import and net export registers properly. To do this:
1. Under "Totals and Virtual Registers", create two new virtual registers "Net.Usage" and "Net.Generation".
2. Set Net.Usage equal to "Net In", and Net.Generation to "Net Out". When done, they should look like this:
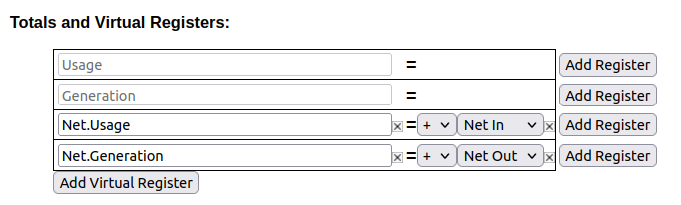 Figure 2: Virtual Register Configuration
3. Save your changes and reboot if prompted.
Once the register split process has been completed, data can be viewed on the main graph page by selecting the "Net" view. The images below show a comparison between the default "total used/total generated" graph and the new "net used/net sold" graph.
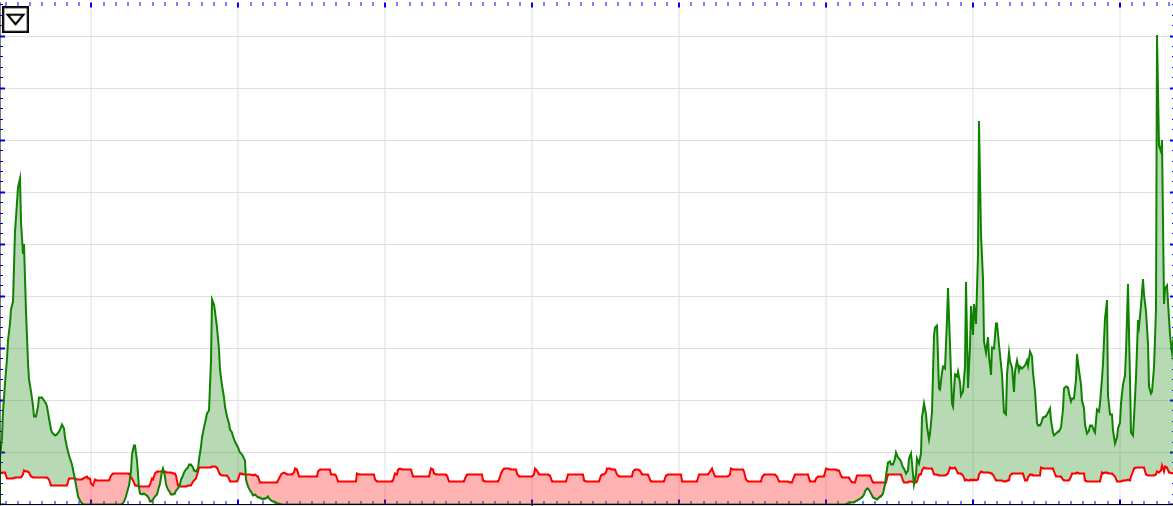
Figure 3: Default view (note overlapping Usage and Generation lines)
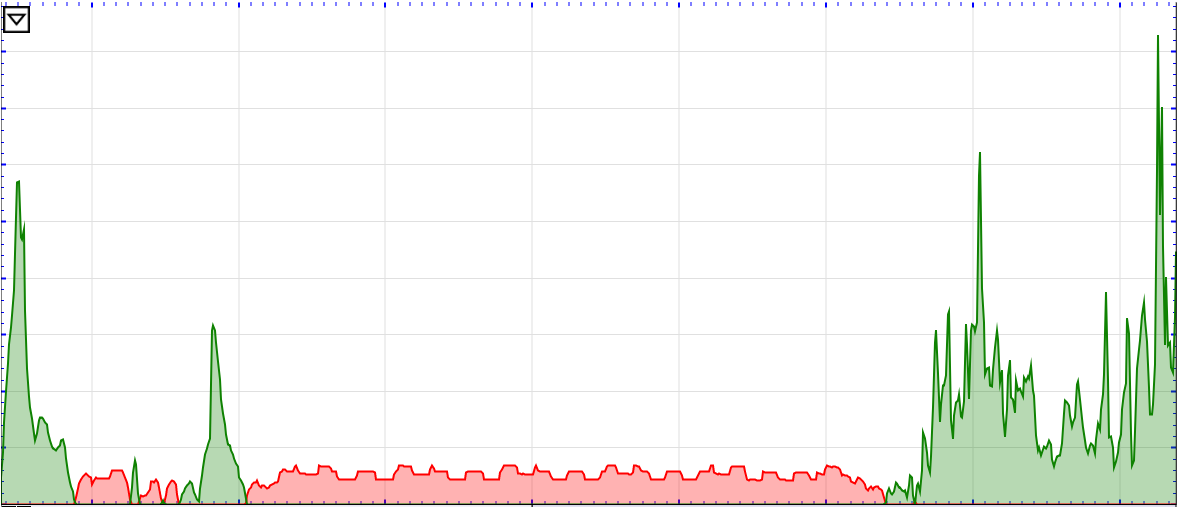 Figure 4: Net view (note power is either moving to or from the utility)