
Alert Viewer
The Alert viewer dashlet was introduced with Firmware v4.6. It can be added to a dashboard to view and manage the eGauge system alerts without navigating away from the current dashboard view.
System alerts are displayed in the Alert viewer in a list form including the alert condition and the date and time when it last triggered. Each alert can be expanded out to show additional detail by clicking on the 'down arrow' on that line as shown below.
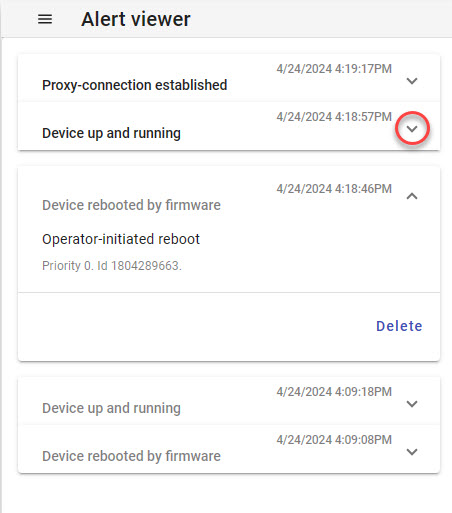
Once an alert has been expanded it will be marked as 'read' or 'acknowledged' and will be displayed in greyed text. The reported alert may be removed from the log by clicking the 'Delete' button. Deleting the alert entry will only remove the log entry, if the alert is triggered again a new log entry for the alert will show in the list.
The Alert viewer has its own menu, similar to the Main menu, with different items:
- Save config to meter - Saves option changes to the Alert viewer dashlet to the meter. This currently saves the default 'Recheck' interval for the Alert Viewer.
- Load config from meter - Load option changes to the Alert viewer that may have been saved on another computer or browser.
- Configure alerts - Choose this item to configure user-defined alerts and related options. For more information please read: Configuring Alerts (Modern Interface)
- Recheck - Use this option to set the interval at which you want your dashlet to automatically refresh with new alerts. Choose 'now' to refresh the list at any time without affecting the set interval.
- Mark all as read - Choose this item to mark all alerts in the list as read. Alerts marked as read will be greyed, new alerts will show up in black text.
- Delete all - Choose this option to delete all existing system alerts from a meter. This cannot be undone.