
Working With Max Demand Export Data
Overview
As of firmware version 3.1.10, the eGauge supports rolling max demand exports through the CSV export function built into the main graph page. These exports contain a rolling average over the past X minutes with a data point presented at the interval requested when creating the export.
Many utilities bill based on rolling max demand averages in additional to total kWh consumption. While it's possible to obtain a rolling max demand average using minute-granular data from a meter, the process is involved and the data overhead is quite large (data for every minute over the period must be downloaded, then the user must calculate a set of rolling averages for each interval, and record the maximum average for an interval). For example, a rolling max demand export over the past 30 days would return 2880 data points (one point every fifteen minutes), while a minute-granular export for the same period would contain 43200 data points (one point every minute).
eGauge Systems cannot assist with utility reconciliation or questions about the billing process used by a specific utility. You'll need to reach out to your utility for assistance with this.
Verifying Settings
The max demand export calculates a rolling average which is X minutes long. X is defined by the value selected for "Length of a demand interval" under Settings -> Preferences.
![]()
This value can be adjusted in one minute increments, from 15 to 60 minutes. Your utility should make their demand interval public (although it may be necessary to contact the utility directly to get this information). eGauge Systems cannot advise as to the correct value to select for this option.
Performing An Export
To perform a max demand export, use the dropdown menu in the top left corner of the main graph page. The export window should look something like the following image. Note that the export type is set to "Max. Demand Value" and the interval is set to 15 minutes.
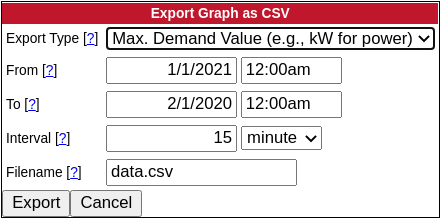
The export interval setting is not the same as the length of a demand interval setting. The former determines how often a data point is returned (eg, one data point for every 15 minute period) while the latter determines the length of the demand interval (eg, how many data points are included when calculating an average).
In other words, a single data point in a max demand export can be described as "the average peak demand over the past N minutes for the time period from XX:XX to YY:YY with a data point every Z minutes", where N is the "Length of a demand interval" setting, XX:XX is the starting time of the export, YY:YY is the ending time of the export, and Z is the export interval.
Example Data
In the example below, two data sets were obtained from the same meter. The first data set (columns A and B) is a minute-granular average value export. The second data set (columns G and H) is max demand data from the same period, with a 15 minute demand interval and a 15 minute export interval.
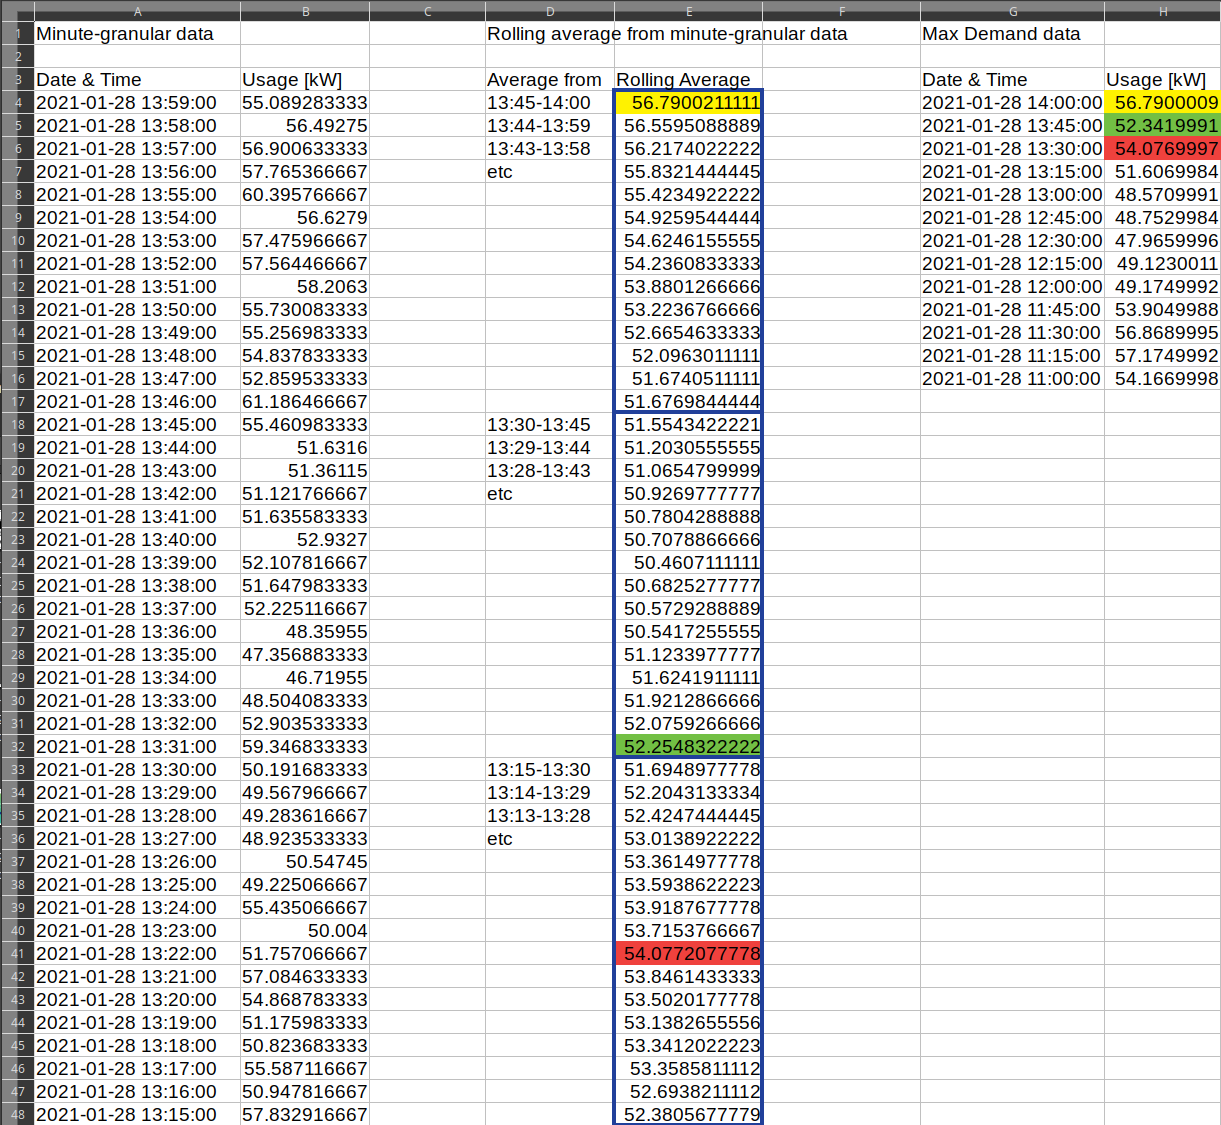
Column E contains a rolling 15 minute average calculated from the minute granular data in column B (the "Length of a demand interval" value). The blue outlines represent 15 minute intervals (the export interval value).
The colored values in column E are the highest value peak) for each 15 minute interval (one per blue box). They are color coded to tie to the same values in the max demand data (column H). Note that these aren't perfect matches - the process used by the eGauge is slightly different, so there will be small differences due to rounding and granularity.