Chart Functions
Editing chart functions is an advanced feature which requires knowledge of JavaScript. eGauge support cannot assist in writing or debugging JavaScript code.
Chart functions allow for the use of JavaScript to calculate new values based on the data recorded in the registers in the meter configuration.
Creating or editing a Chart function
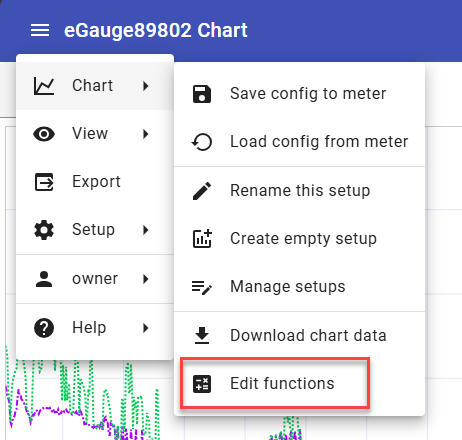
The Chart Function editor can be accessed from the main menu by choosing Chart → Edit functions
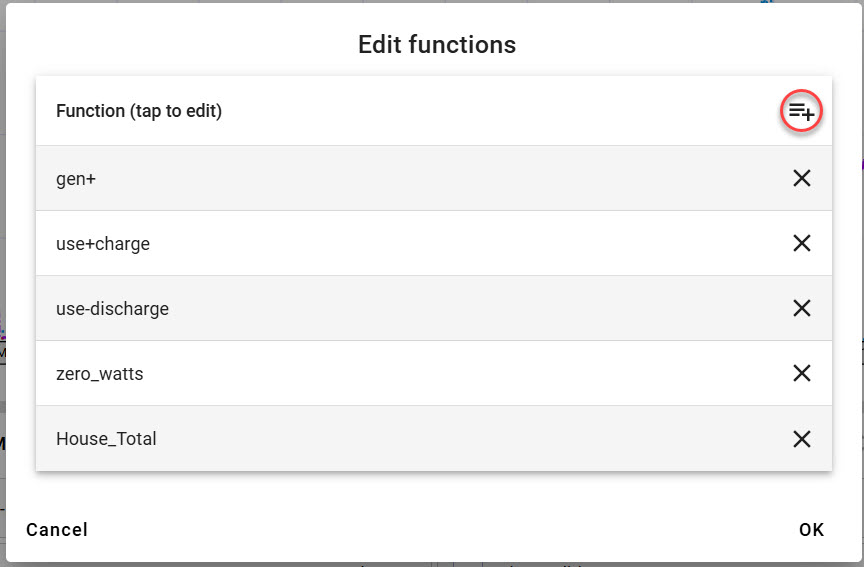
Click on an existing chart function to edit it or click on the Add function icon to add a new one. Click the X to delete an existing chart function:
The Chart function editor is shown below with an example function:
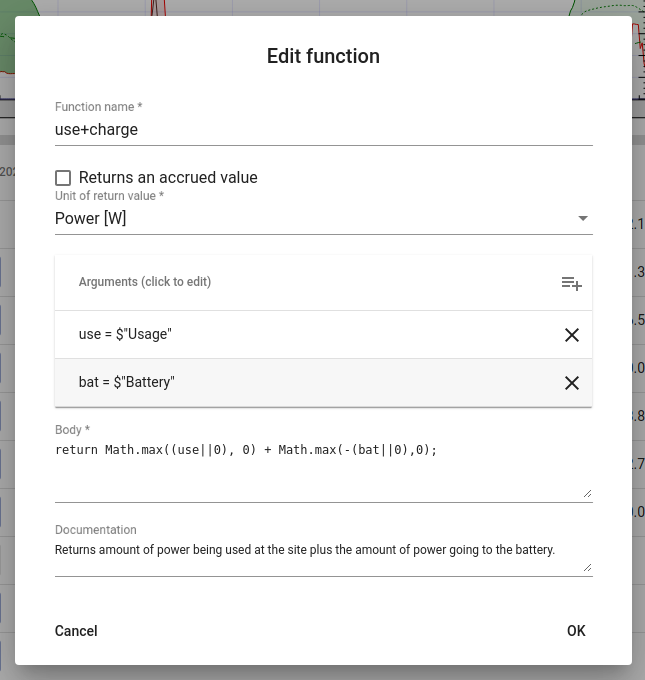
Function name - (mandatory field) An arbitrary, unique name selected by the user. This is only used within the eGauge chart and does not need to be a valid JavaScript function name. In the example script shown above, the Function name is use+charge
Returns an accrued value - Enable this option to return an accrued (cumulative) value. Leave this option disabled to return an instantaneous value.
Unit of return value - (mandatory field) Selects the unit the value returned by the function displays as. In the example script above, this is set to Watts. This value should be changed depending on the unit of the calculation being performed by the function.
Arguments - This table defines the list of values to be passed to the function. Only register values can be passed as arguments. Argument names must be valid JavaScript identifiers.
In the example script shown above there are two arguments defined. use which is being passed the instantaneous value of the eGauge Usage Virtual register (defined as $"Usage") and bat which is being passed the instantaneous value of the "Battery" Virtual register (defined as $"Battery"). Both "Usage" and "Battery" are register values defined in the eGauge Installation settings (link) of the meter.
Body - This section defines the calculations to be performed by the function.
In the example above, the body calculates the sum of how much power is being used at the site plus how much power is going into the battery to charge it.
If a function argument refers to a register that no longer exists in the meter configuration settings, its value will be Undefined. This is the reason for using "||0" in the code above: it ensures that if either the usage or battery virtual registers are undefined, a value of 0 is used instead.
Note that the body may be an arbitrary JavaScript function body and does allow for nested functions. Example:
function reg_or_zero(reg) {

  return reg || 0;

}

return reg_or_zero(use);
Documentation - A field for adding a description of what the function does
Click 'OK' to save your chart function.
Graphing Chart functions
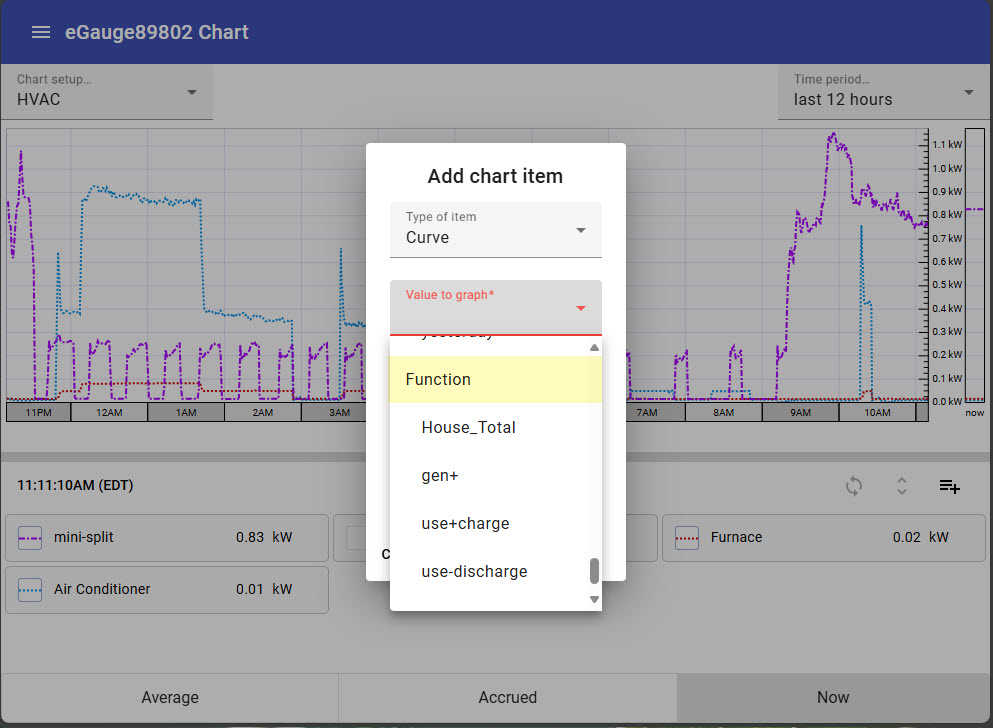
Saved chart functions will appear in the list of values to graph after register values. To add a saved chart function to a chart, add a new chart item and choose the chart function from the list of items displayed in the Value to Graph dropdown list. The chart function will behave as any other chart item.