Dashboard
Overview
Available in firmware v4.1 and newer, the eGauge interface has a new mobile-friendly dashlet interface available to use on mobile and desktop browsers. This interface (referred to as the Modern user-interface) is designed to provide improved customization and reduced clutter compared to the classic eGauge UI.
A brief video overview is also available.
Make sure to read the main Modern User Interface page before continuing.
Contents:
Dashboard Appearance and Layout
Accessing the Dashboard
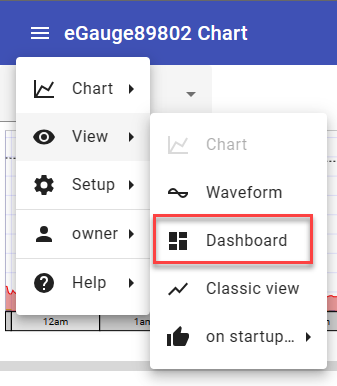
The Modern UI defaults to a chart view. To access the Dashboard for customization, use the main menu button in the upper left corner of the screen to navigate to: View -> Dashboard.
Mobile browsers will default to the Modern user interface.

Dashboard Management
Introduced in Firmware v4.6, the Dashboard Manager is used to view the list of existing dashboards on an eGauge meter. From this page you can also create a new dashboard, make a copy of an existing dashboard for editing and delete Dashboard views that are no longer needed.
To access the Dashboard Manager, from the Dashboard view choose Dashboard → Manage dashboards. For full details please see: Dashboard Manager
Dashboard Examples

Dashboard with Usage and Generation dials, and summary area.

Dashboard with Flow Diagram showing a home's usage with solar and wind back-feeding to utility.
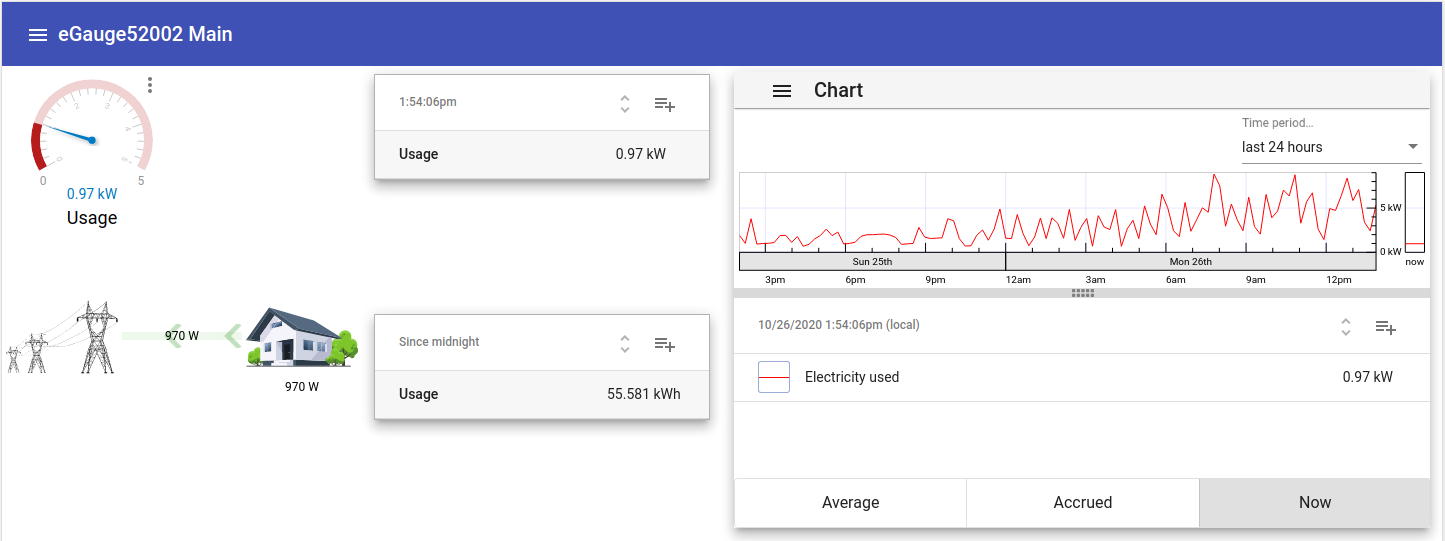
More complex Dashboard with a variety of dashlets monitoring total site usage in different ways.
Dashboard Appearance and Layout
The dashboard appearance and layout can be customized by the user. A single dashboard is made up of multiple individual components called "dashlets". Each dashlet can be placed and sized independently of every other dashlet. Dashlets snap to the the dashboard automatically.
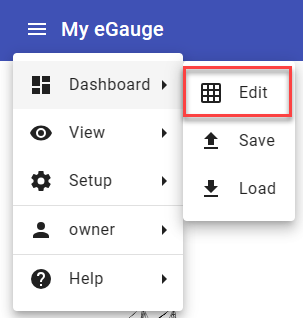
To add, delete, resize or move dashlets, access the Dashboard and then, click the menu icon in the upper left hand corner and choose "Edit":
A bar will appear at the top:

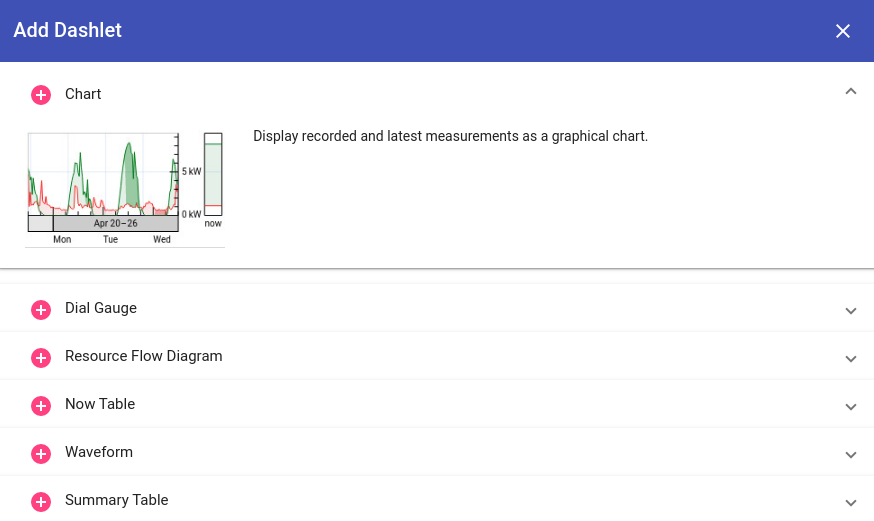
To add a dashlet, click the + sign on the left. A menu will appear with available dashlets. Click the plus button to add the dashlet, or anywhere else in the row to see more information on the dashlet.
To delete a dashlet, click on the dashlet so it is selected (entering edit mode), and press the center trashbin icon. To exit edit mode, click the X on the right side.
To resize or move, click the dashlet and a box will appear around it. It can then be dragged to a different location, and clicking and dragging the circles on each side will resize the dashlet.

Configuring Dashlets
In "Edit" mode, clicking the + button to add a dashlet will show available dashlets.
Available dashlets
- Chart: Displays measurements as a chart (graph) view. For more information on creating and modifying charts, see this article.
- Dial Gauge: Displays the most recent value of a single register as a dial gauge. It is also possible to display markers indicating the minimum and/or maximum values of that register over a certain time period (e.g., over the last 24 hours).
- Resource Flow Diagram: Visualizes how resources flow between user-selected icons. Can be used, for example, to show how power flows from the grid to a house or from a solar panel to the house.
- Now Table: Displays a table of the most recent measurement values. Each table row displays the most recent value of a register.
- Waveform: Shows waveform data obtained from raw inputs (voltage taps and current transformers). Similar to an oscilloscope. More information on the waveform view is available here.
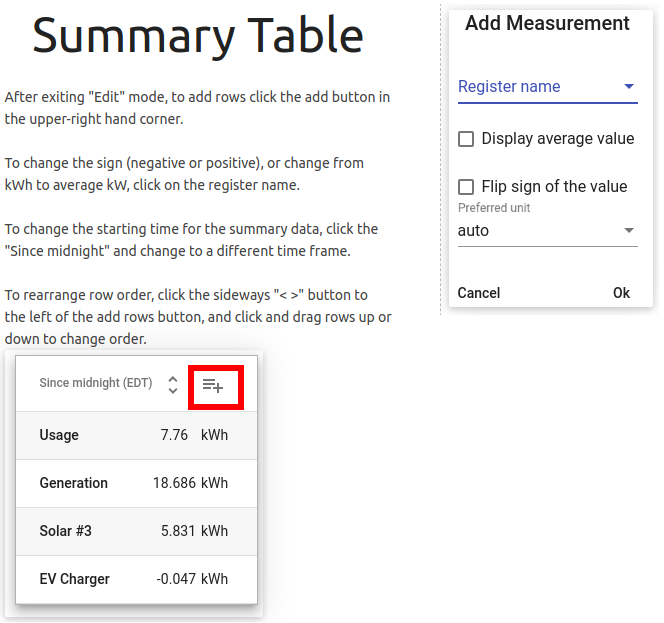
- Summary Table: Displays a table of measurement summary values. Each table row shows either the accumulated value or the average value of a register over a summary period. The summary period is selectable and can be a running summary (e.g., since 24 hours ago) or a set summary (e.g., since start of the day).
- Signal - Shows one of two signal icons based on a comparison of a register value against a constant.
- Export - Configure settings to download meter data in .csv format (firmware v4.6 and later)
- Switch - An on/off switch that is manually activated. Can be used to control the eGauge PRM3 power relay module.
- Alert Viewer - View and manage the eGauge system alerts without navigating away from the current dashboard view. (firmware v4.6 and later)
Charts created in the Dashboard view cannot be opened in the Chart view (and vice versa).
For the purposes of this article, dashlets will be split into two categories - simple and complex. Simple dashlets typically have minimal configuration options. Complex dashlets will have many more configuration options (and in some cases, dedicated articles explaining the full functionality of the dashlet).
Simple Dashlets


Signal Dashlet
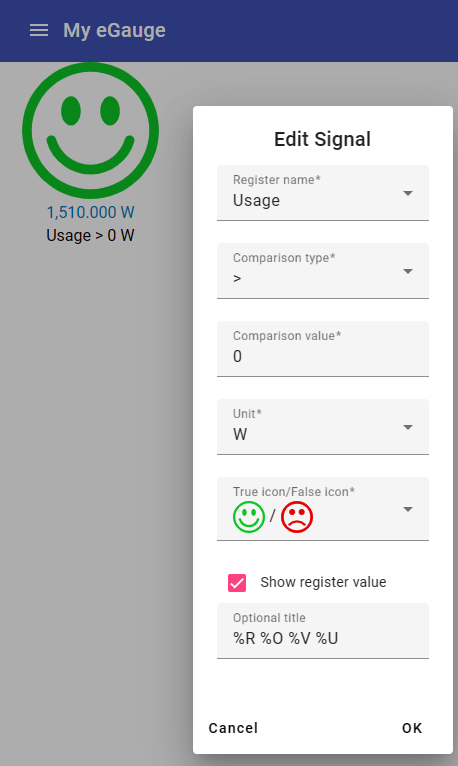
The signal dashlet can be used to tell at a glance if a particular reading is above or below a particular threshold. Choose the register to alert on, the comparison type and the constant comparison value that will act as the threshold between the signal icons.
Complex Dashlets
Resource Flow Diagram
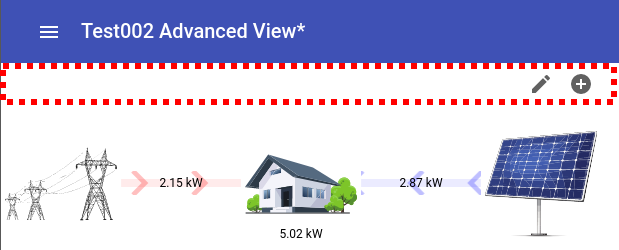
To edit the Resource Flow Diagram dashlet, exit "Edit" mode after adding. Then, hover the mouse or press along the top of the dashlet, shown in the red dashed line below. The pencil icon and plus sign should appear:
Clicking the pencil icon will allow you to edit or delete any existing item in the diagram. Click the icon to edit it, or the X in the lower right-hand corner to remove it from the diagram:

To exit edit mode, hover the mouse back over the top bar and click the pencil icon again.
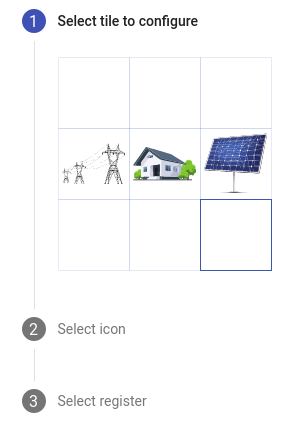
To add an icon, click the plus button and select a grid location to add an item to. In the image below, the bottom-right corner has been selected:
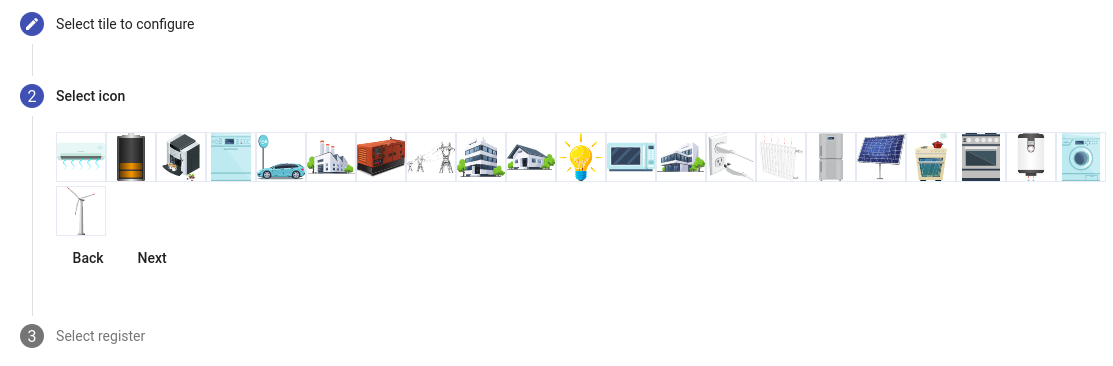
Then click the blank box to choose an icon:

A list of icons will appear. In this example, the Windmill icon was selected:
Finally select the associated register, in this case "Wind inverter":

Exit the edit mode by clicking the pencil icon, and the dashlet will contain the newly added item. Positive values indicate power is flowing from the item to the center of the diagram (generation), while negative values indicate power is flowing to the item from the center of the diagram (load). If the polarity is incorrect, either reverse it in the register or create a virtual register to flip the sign to avoid disrupting historical data. Creating a virtual register is recommended.

Waveform Dashlet
Unlike most other dashlets, the Waveform dashlet requires a significant amount of space to utilize effectively. It is not recommended for users with small or low-resolution screens. A dashlet size of 900x900px is generally adequate, but larger is better in terms of functionality and readability.
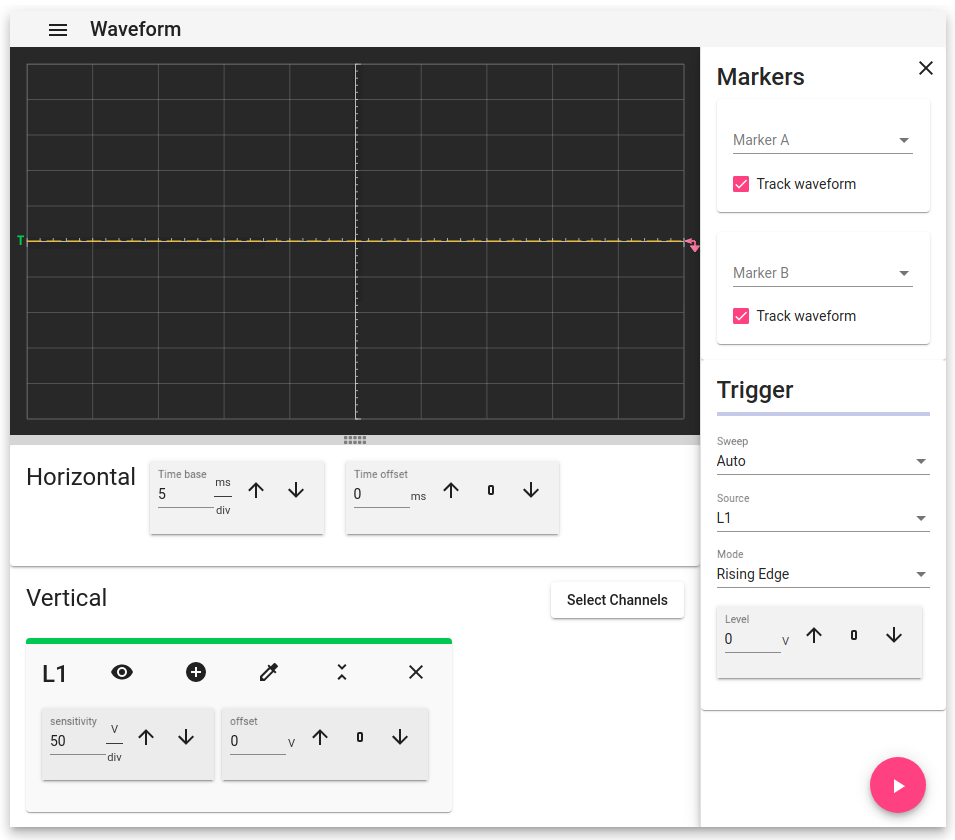
Once in place, the Waveform dashlet is controlled just like the dedicated Waveform View page. Full documentation on the Waveform View page is available here.
The Waveform View is very resource intensive. On devices with slow connections, it may work poorly or not at all.
Chart Dashlet
The Chart Dashlet allows the user to present a variety of information in graph form. Like the Waveform dashlet, it requires a significant amount of space. A dashlet size of 600x600px is generally adequate, but larger is better in terms of functionality and readability.
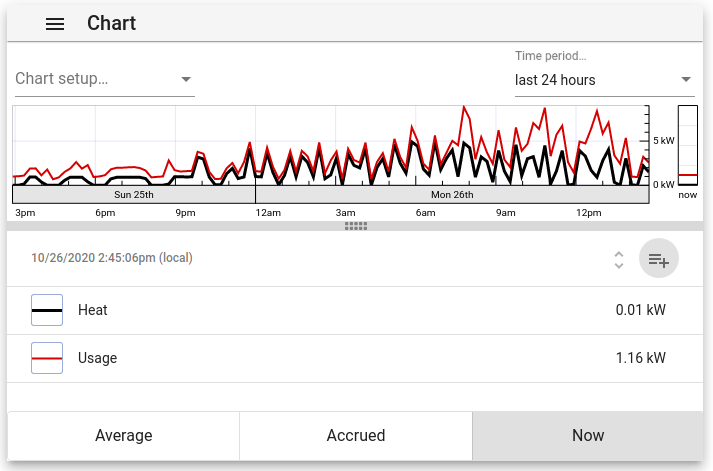
Once in place, the Chart dashlet is controlled just like the dedicated Chart element. Full documentation on the Chart Element is available here.
Charts created in the Dashboard view cannot be opened in the Chart view (and vice versa).
Export Dashlet
The Export dashlet has the same functionality as the Modern Interface Export function found in the Main Menu. As a dashlet, you can multiple Export dashlets to a dashboard, each with its own settings. For full details on using the Export function see: Modern Interface Export
Switch Dashlet
The Switch dashlet requires special user permissions and hardware to be utilized. In order to use and display this dashlet the user must be logged into the device with user credentials where the permission level is set to: 'Allowed to view data, change settings and control devices from anywhere' For more information about setting up user accounts please see: Creating usernames and passwords
At this time the Switch Dashlet can only be used to control the eGauge PRM3 Power Relay Module which will need to be physically connected to an EG4xxx meter via USB. The Switch Dashlet and PRM3 module are not compatible with Legacy EG3xxx or eGauge2 meters.