Submetering
The EG4xxx series meters are capable of monitoring up to 7 single-phase units (EG4015) or 15 single-phase units (EG4030) with a single meter. Single-phase units require 2 CTs each, one for each phase.
Please visit Getting Started for an overview of the physical installation and configuration process.
Example Wiring Diagram
Below is an example diagram of an EG4015 measuring 7 single-phase units on a distribution panel.
Ensure the meter's L1, L2, and L3 breakers are the same phases as the panels L1, L2, and L3 phases, or a phase-mixup will occur and recorded data will be incorrect. See this article for more information on phase checking.
The meter in the diagram shown below does not reflect the physical layout or dimensions of the eGauge meter.
Panel layout and installation will vary. The meter must be configured in software to match the physical installation before any data will be recorded.
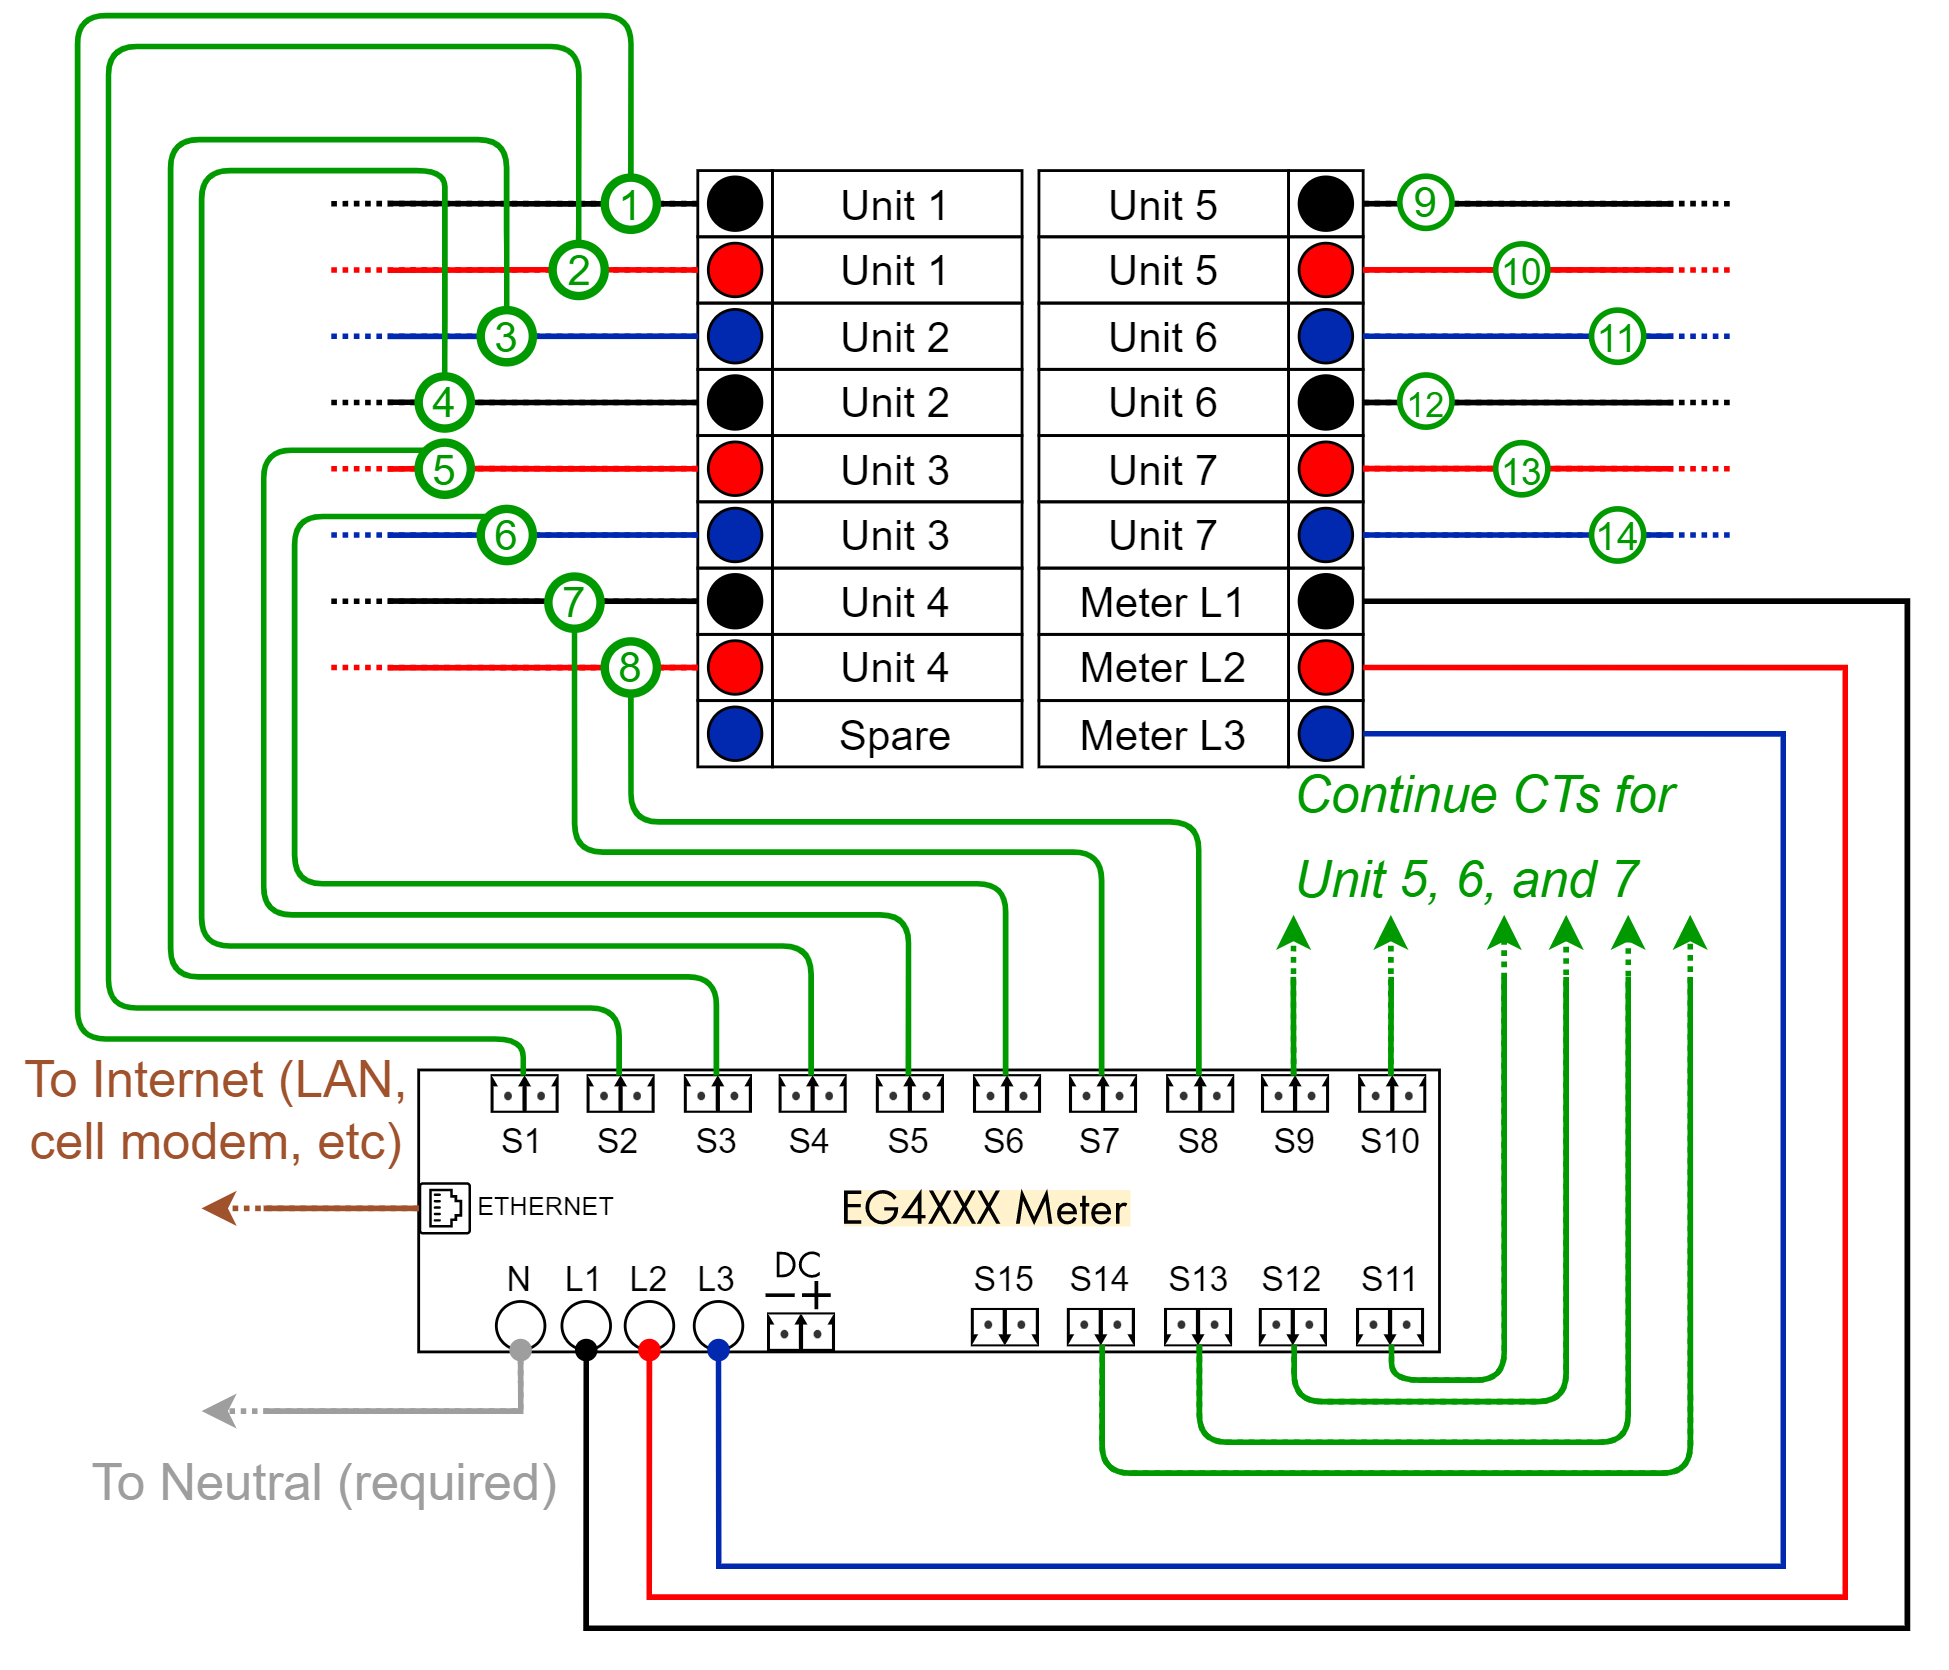
A diagram showing the CT connections for the last 3 units from above may be found here.
Example Configuration
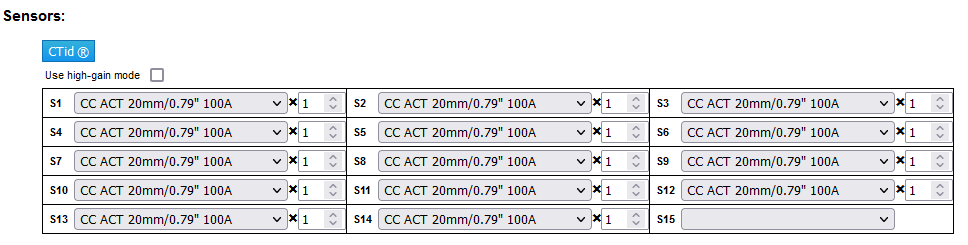
Sensors (CTs)
In most submetering installations the same model CT will be used on all breakers. In this example, all CTs are set as 100A 20mm AccuCTs. If using CTid CTs, please click the blue CTid button to configure CTid sensors.
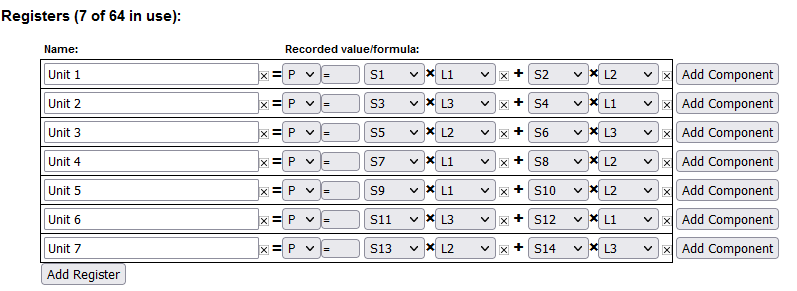
Registers
Registers define the data points the Gauge meter records. Each power calculation consists of a sensor input (S1, S2, S3...) that has the CT, and the voltage phase it is on (L1, L2, L3). Since each single-phase unit uses 2 CTs, there are 2 power calculations in each register added together to define the total usage of that unit.
Note, while the phasing pattern for units is typically staggered as L1 and L2, then L3 and L1, then L2 and L3, and so on, in the above example this changes with Unit 5 because the breakers for Unit 5, 6, and 7 begin on the right-hand side of the panel.