# Pulse Sensor (EPS)
##### [ Visit the online store page](https://store.egauge.net/pulse-sensor-eps "Visit the online store now!")
##### Model: EPS
Requires the [**eGauge Sensor Hub**](https://kb.egauge.net/books/egauge-hardware-product-pages/page/sensor-hub-%28esh044%29 "eGauge Sensor Hub") and eGauge model EG4xxx (Pro or Core), not compatible with older model units.
Only use straight-through RJ-11 cables to connect powered sensors to the Sensor Hub. Telephone systems generally use "reverse" style RJ-11 cables which are incompatible with the Sensor Hub. See **[this article](https://kb.egauge.net/books/egauge-installation/page/rj-11-wiring-between-sensor-hub-and-sensors)** for more information on verifying the correct RJ-11 wiring. Every Sensor Hub compatible sensor sold by eGauge Systems comes with a straight-through RJ-11 cable.
The eGauge Pulse Sensor is used in conjunction with the [Sensor Hub](https://kb.egauge.net/books/sensors/page/sensor-hub-%28esh044%29) and an EG4xxx model meter (Core or Pro) to record pulse output data from devices such as water and gas meters. The Pulse Sensor can accept standard 2-wire pulse outputs or 3-wire 5-volt Hall effect pulse outputs.
[See our Sensors product introduction video here](https://www.youtube.com/watch?v=6D82guIQP50&feature=youtu.be).
| [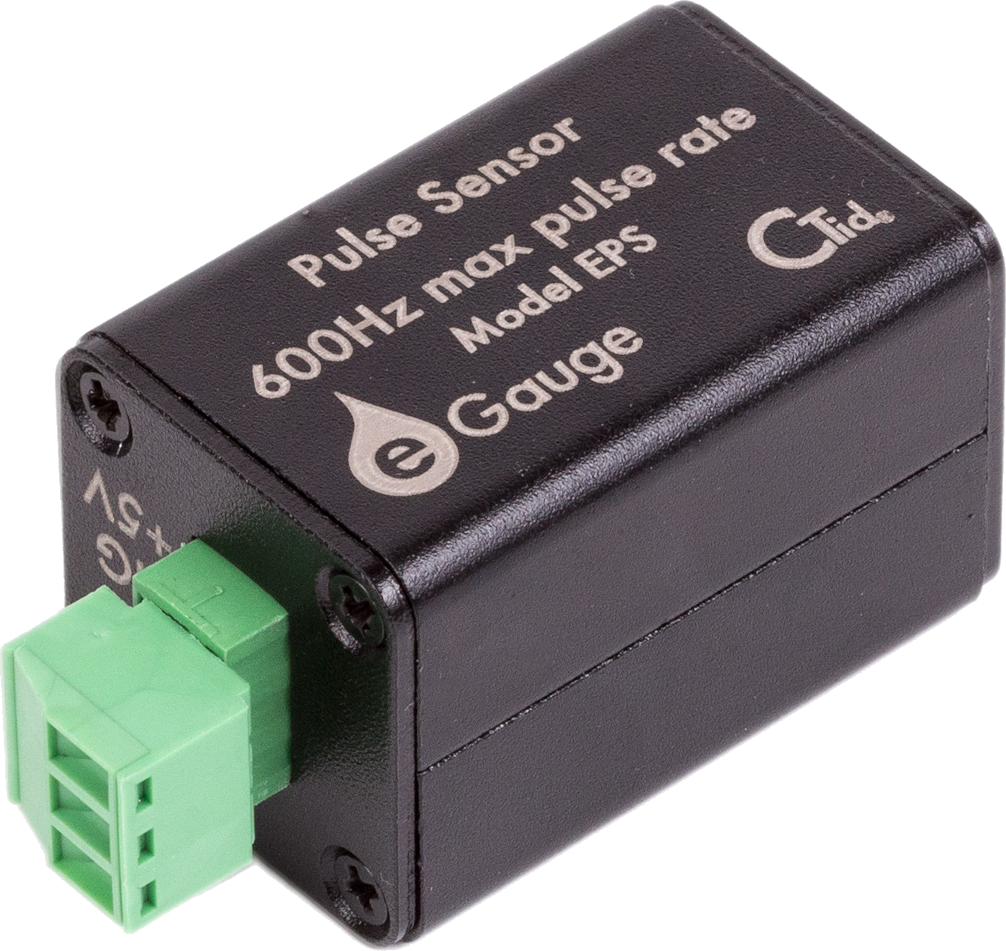](https://kb.egauge.net/uploads/images/gallery/2020-02/pulse-sensor-1006x951-transparent.png) | [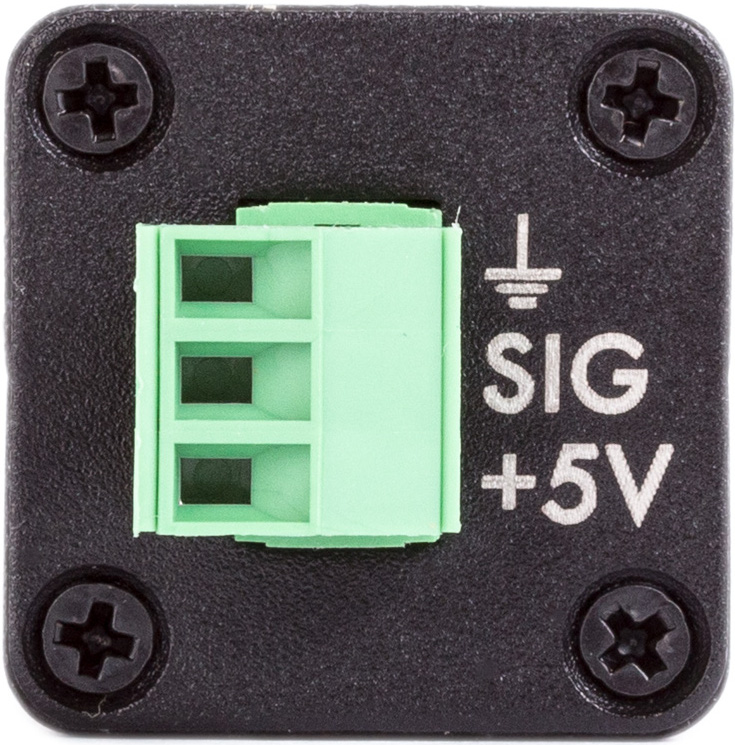](https://kb.egauge.net/uploads/images/gallery/2020-02/pulse-topdown.png) | [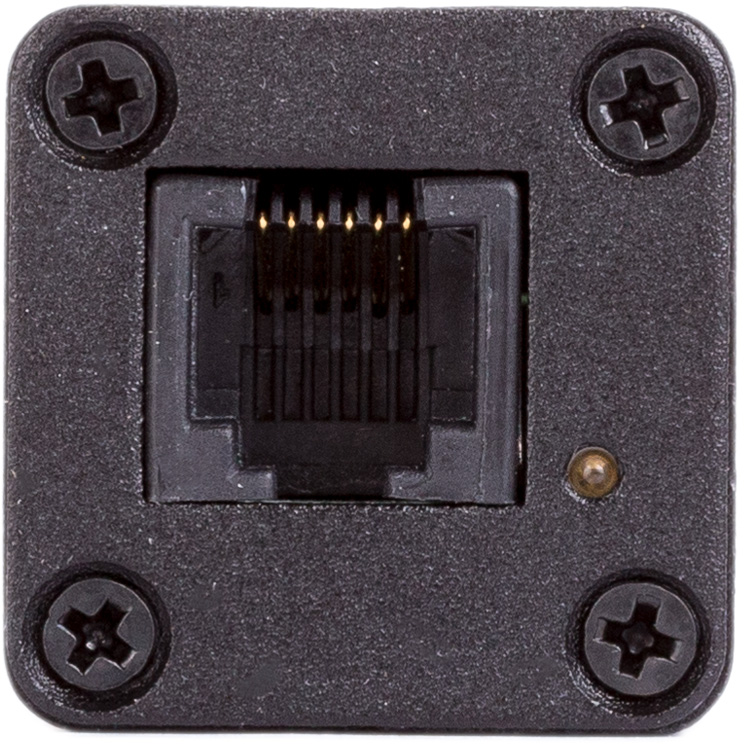](https://kb.egauge.net/uploads/images/gallery/2020-02/sensor-rj11.png) |
| *Side view of EPS* | *Front view of EPS with connections* | *Back-side of EPS with RJ-11 port and CTid locator LED* |
## Specifications
#### [Full specs (data-sheet PDF)](https://kb.egauge.net/attachments/15)
[CAD file (STEP format)](https://www.egauge.net/media/support/docs/EPS.STEP)
- CTid Enabled (w/ auto-configure and locator LED)
- Compatible with 2-wire pulse output and 3-wire 5-volt Hall effect pulse output
- Up to 600Hz max pulse rate
- 4.7 kΩ pull-up resistor between Signal and 2V
- Signal pin: open- 2V; closed- 0V
- -30 °C to 70 °C
- Humidity range: Up to 80%
- Extruded aluminum Case
- 26 x 26 x 40 (mm), 1.02 x 1.02 x 1.57 (in.)
- 7' RJ-11 cable for Sensor to Sensor Hub
- 47 CFR Part 15, Subpart B – Unintentional Radiators, Class B for Home or
Commercial use
- US Patent # 10560763
- 2-year limited warranty
## Hardware included
- 1x eGauge Pulse Sensor
- 1x 3-pin input plug
- 1x 7’ RJ-11 cable for connection to Sensor Hub
## Assembly/installation information
1. It is not advisable to extend the RJ11 leads from the Sensor to Sensor Hub. It is acceptable to use a longer RJ45 cable from the *Sensor Hub* to the *eGauge*.
2. If RJ11 cable between *Sensor* and *Sensor Hub* must be extended, it is advisable to use twisted pair wires, such as a CAT5 cable with RJ11 plugs (most commonly used for DSL modems).
3. If terminating own cables, both RJ11 and RJ45 cables should be straight-through cables, with the same color order on both ends.
1. [Install the sensors and Sensor Hub](https://kb.egauge.net/books/sensors/page/sensor-hub-%28esh044%29).
2. Connect the EPS sensor to the pulse output using the signal and ground pins. If using a 5V hall effect sensor, the 5V pin may be utilized, otherwise it is left unused.
3. [Configure the sensors](https://kb.egauge.net/books/sensors/page/configuring-ctid-enabled-sensors).
Note: Ensure the pulse sensor is configured for "normal value", not mean or frequency.
[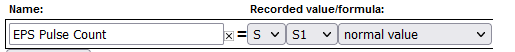](https://kb.egauge.net/uploads/images/gallery/2021-08/image-1629827906288.png)
## Documents
- [Spec Sheet](https://kb.egauge.net/attachments/15)
- [FCC declaration](https://kb.egauge.net/attachments/25)
- [CAD file (STEP format)](https://www.egauge.net/media/support/docs/EPS.STEP)
## Related Information
- [Sensor Hub Product Page](https://kb.egauge.net/books/egauge-hardware-product-pages/page/sensor-hub-%28esh044%29)
- [Configuring CTid Sensors](https://kb.egauge.net/books/egauge-meter-configuration/page/configuring-ctid-enabled-sensors)
## Diagrams
#### 2-Wire Pulse
[](https://kb.egauge.net/uploads/images/gallery/2020-02/pulse-dry.png)
#### 3-Wire 5V Hall Effect
[](https://kb.egauge.net/uploads/images/gallery/2020-02/pulse-hall.png)
#### Typical Setup Overview
[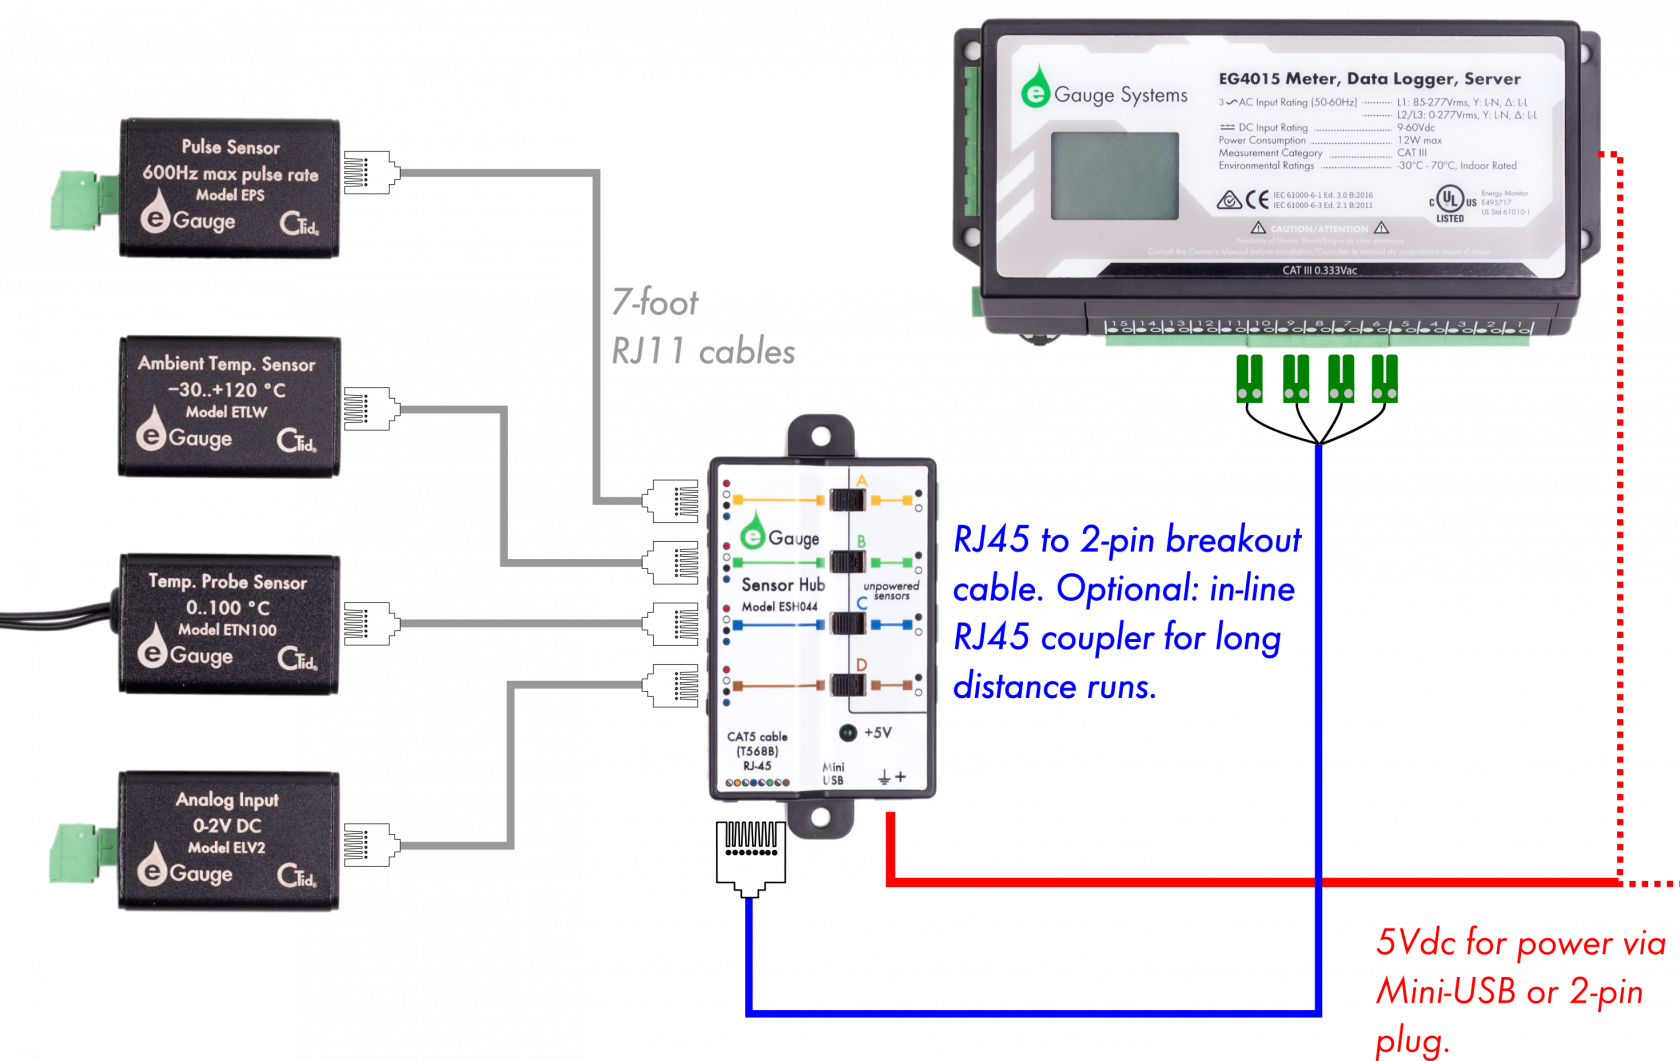](https://kb.egauge.net/uploads/images/gallery/2020-02/image-1582232841726.png)
## Advanced Diagnostics and Notes
#### Simulating Pulses
Pulses may be simulated on the EPS by shorting the Signal and Ground pins together. Any state change counts as a pulse, so connecting a wire between the Signal and Ground pins will count as one pulse, and removing the wire will count as a second pulse.
#### Viewing the Pulse Signal
The meter's [Waveform View](https://kb.egauge.net/books/egauge-meter-ui/page/waveform-view), in addition to viewing voltage and amperage waveforms, may also be used to view sensor inputs such as the EPS.
[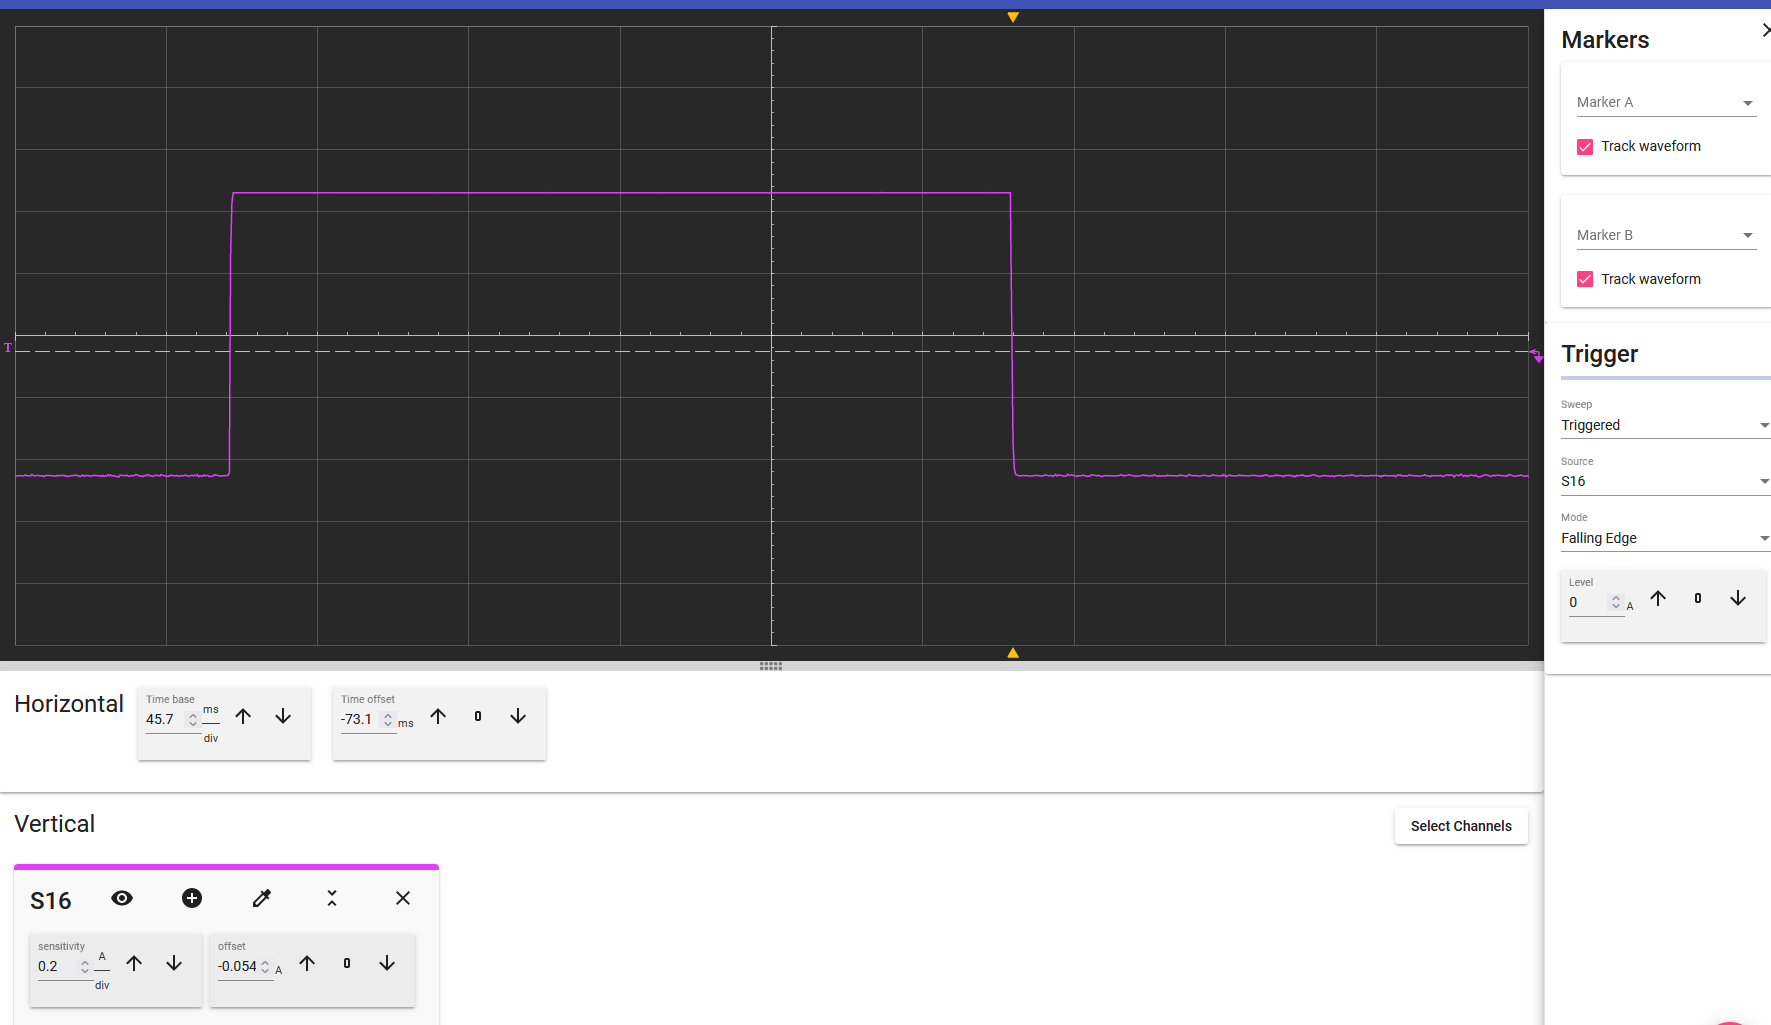](https://kb.egauge.net/uploads/images/gallery/2022-01/image-1642182071444.png)
The above screenshot shows an EPS transitioning from open (low) state, to closed/shorted (high), back to open (low). Any transition, from low to high or high to low is counted as a single pulse. Thus, 2 pulses were counted during this capture.
The Horizontal controls show the time is 45.7ms per division, and the two state changes occur over approximately 5 divisions total, meaning 2 pulses were counted over the course of around 0.23 seconds (45.7ms \* 5 divisions).
The EPS has a maximum resolution of 600 pulses per second.
Note the amplitude of the low and high states are around +/- 0.42 units (based off the sensitivity per division in the vertical sections).
[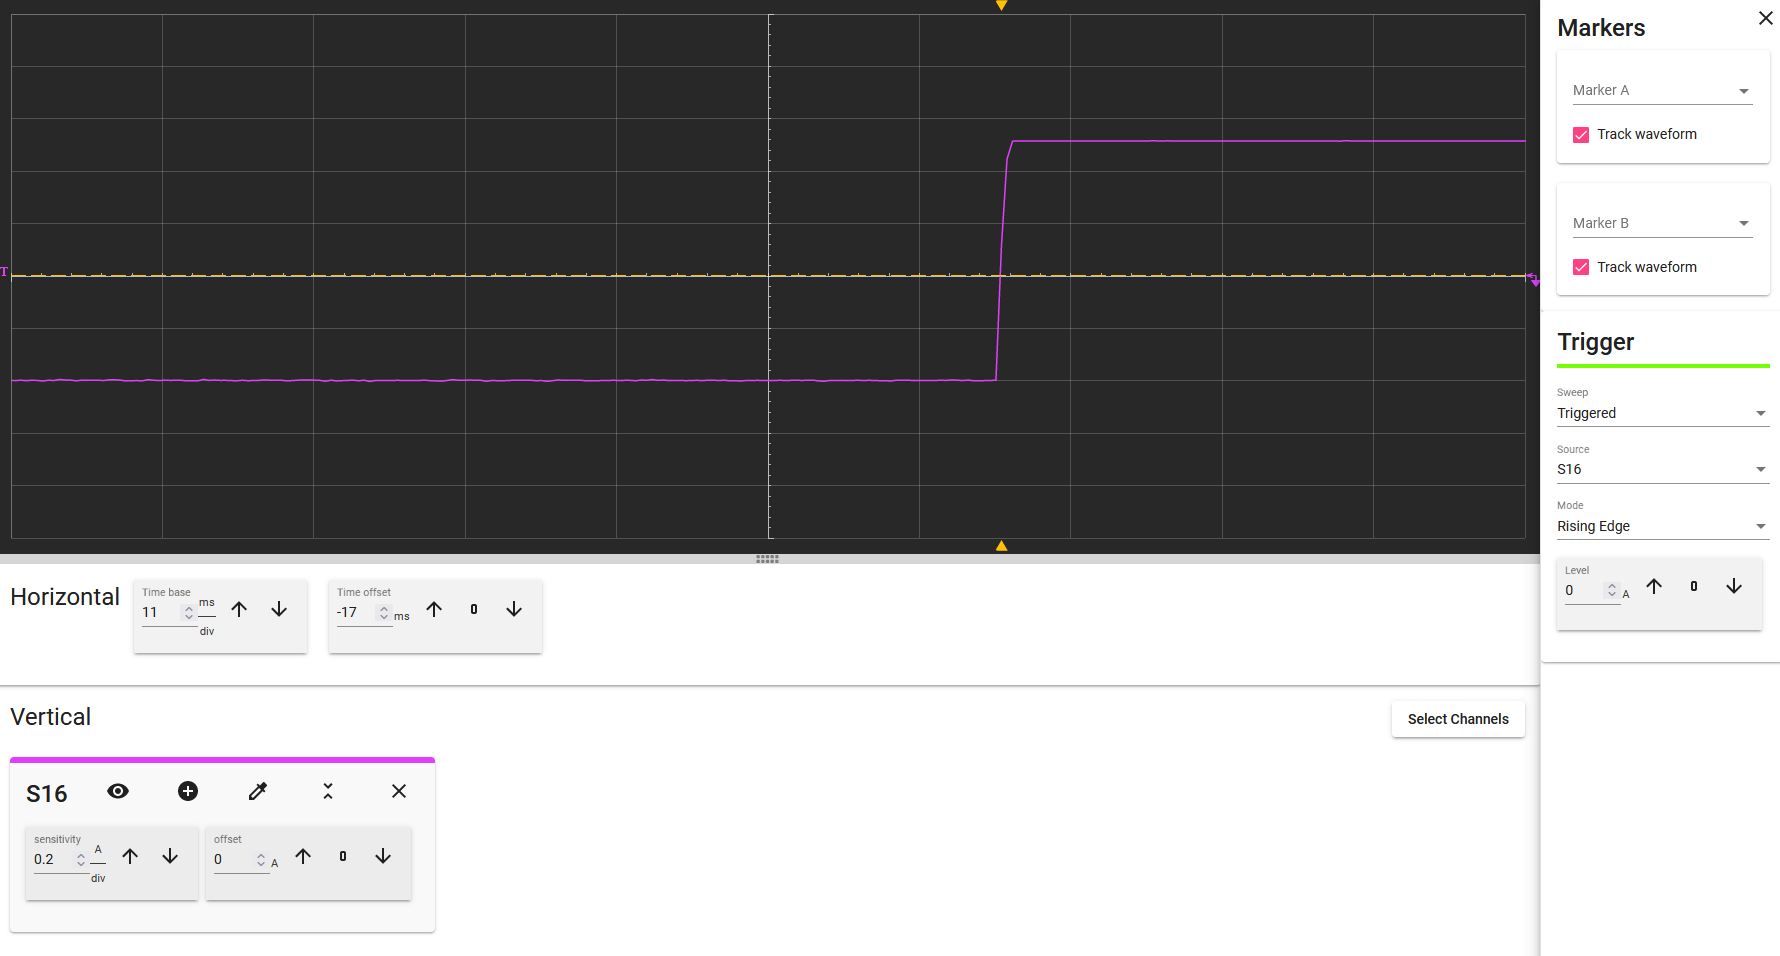](https://kb.egauge.net/uploads/images/gallery/2022-01/image-1642182798033.png)
Similarly, the above Waveform view shows a single pulse, as the state transitions from low to high. When the next pulse occurs, the state changes from high to low and will count another pulse.