Advanced eGauge Operation
Covers advanced operations, such as working with Alerts and other advanced software features
- USB thumb-drive functionality
- Automated USB Export and Upgrade scripting file
- USB Data Exports through LCD
- Formatting a USB stick on Windows 10
- Alerts
- Configuring eGauge Alerts (Modern Interface method)
- Alerts and Email Gateway with SendGrid
- Configuring eGauge Alerts (Classic Interface method)
- Example and description of JSON alert POST data
- Zero out data/spikes tutorial
- eGauge language options and adding new languages
- High Gain Mode
- Connecting via the eGauge proxy server using IE 10/11
- Monitoring High Voltage Systems
- Formula registers and remote devices
- Register ID and location
- Working With Max Demand Export Data
- Monetary registers
- Lua Scripting
- Chart Functions
USB thumb-drive functionality
eGauge Core/Pro have USB and thumb-drive storage functionality
Automated USB Export and Upgrade scripting file
Introduction
Starting with firmware v3.4, eGauge firmware supports USB Mass-Storage devices on hardware with USB ports (e.g., EG4015 (Core) and EG4030 (Pro)). Both Windows VFAT and Linux EXT3 filesystems are supported. When the eGauge device detects a valid storage device, it will automatically bring up a USB Storage menu on the LCD screen. From there, it is possible to select various operations, such as:
-
Creating a backup of all eGauge data
-
Exporting data to a CSV (comma-separated-values) file.
-
Updating the device firmware.
-
Ejecting (unmounting) the storage device so it can be removed safely.
For flexibility and to simplify operations when it is necessary to perform the same USB Storage task on multiple devices, the firmware also supports a script file called auto.run. When this file is present in the top-level directory (root folder) of the USB storage device, it will be executed as soon as the USB storage device is detected by the firmware. The details of how this file is executed are specified below.
Scripting Language
The auto.run file consists of a sequence of text lines, each line containing a command. Commands are executed in sequence, one by one. If a command fails for any reason, script execution stops and the most recent error is displayed on the LCD screen. The operator needs to acknowledge the error by pushing the multiswitch button and, once that is done, the USB Storage menu is displayed.
In the absence of errors, script execution stops upon reaching the end of the script file or after execution of an "eject" command (see below). After reaching the end of the script, the USB storage menu is displayed on the LCD. After an "eject" command, the LCD screen reverts to normal operation. The USB storage device is then no longer accessible until the USB storage device is removed and reinserted into the USB port or the device is rebooted (e.g., power cycled or rebooted via firmware).
Script files may contain line-comments that start with a hash character (#). The hash character and any following characters up to the end of the line are ignored.
Script Commands
In the following descriptions, square brackets are used to indicate optional parts of a command. Italics is used as place-holders for variable content.
backup [FILENAME_TEMPLATE]
Backup the eGauge device data to the file specified by FILENAME_TEMPLATE. This string may contain references to variables that are expanded as follows:
|
Variable Reference |
Expands to |
Example |
|
${DEVNAME} |
eGauge device name |
eGauge1234 |
|
${SN} |
eGauge serial number |
1701260002 |
|
${TIME} |
current date and time |
20180411-1310 |
If FILENAME_TEMPLATE is omitted, the template:
backup-${DEVNAME}-${TIME}.bin
is used by default.
export [PERIOD [GRAN [FILENAME_TEMPLATE]]]
Export eGauge device data to the file specified by FILENAME_TEMPLATE. The data is saved in comma-separated-values (CSV) format. The file-name template may use the same variables as the backup command. In addition, the following variables are supported:
|
Variable Reference |
Expands to |
Example |
|
${PERIOD} |
export time-period |
ytd |
|
${GRAN} |
export granularity |
hour |
PERIOD specifies the time period of the data to be exported:
|
Period specified |
Time range covered |
|
day |
Most recent 24 hours of data are exported. |
|
month |
Most recent 31 days of data are exported. |
|
year |
Most recent 366 days of data are exported. |
|
all |
All data is exported. |
|
dtd |
day-to-date: export data from midnight up to current time |
|
mtd |
month-to-date: export data from start of month up to current time |
|
ytd |
year-to-date: export data from start of year up to current time |
GRAN specifies the granularity (resolution) with which the data is exported:
|
Granularity specified |
Resolution |
|
sec |
Second resolution (or best available). |
|
min |
Minute resolution (or best available). |
|
quarter |
15-minute resolution (or best available). |
|
hour |
Hour resolution (or best available). |
|
day |
Day resolution. |
Note that the eGauge device database internally uses varying granularity to balance storage requirements with the ability to retain data for long time periods. Specifically, second-by-second data is typically retained only for the most recent hour, then dropping to minute-granularity, until at last day-by-day data is available for the longest amount of time (e.g., 60 years). The granularity specified in the export command is the finest resolution to be used during the export. If the database doesn't have the data available in the desired resolution, it will automatically exported in the best available resolution.
Also worth mention is that day-granularity data is captured every day at midnight UTC. The date and time exported in the CSV file is converted to the device's time-zone, which means the hour seen in the exported data may be one or the other, depending on whether or not daylight savings is in effect. For example, in US/Mountain time-zone, day-granularity data is captured at 6pm (18:00) during the summer months and at 5pm (17:00) during the winter months.
update_fw [[PATH] force]
Update the device firmware using the file specified by PATH. If PATH is omitted, the file fw.bin will be used.
The update will be performed only if the file contains a firmware newer than the one that is currently installed. However, if option "force" is specified after the file path, the update will be performed regardless of the version currently installed on the eGauge device.
After a successful update, the LCD screen will indicate that the device needs to be rebooted. The operator needs to confirm this by pushing in the multiswitch button and that point, the eGauge device reboots itself to activate the new firmware.
eject
This command ejects (unmounts) the USB storage device and stops script execution. Once the command has finished, the LCD screen returns to normal operation and it is safe to remove the USB storage device from the USB port at that point.
Example Script
In the following example, let's assume the device name is "eGauge1234" and the commands are all executed on April 1st, 2018, at 1:14pm (13:14).
# This is a comment.  It has no effect on execution.

# OK, let's do a backup first:
backup # will be saved in "backup-eGauge1234-20180401-1314.bin"

# Export data to "data-eGauge1234-ytd-hour.csv":
export ytd hour data-${DEVNAME}-${PERIOD}-${GRAN}.csv

# Eject USB storage and return eGauge device to normal operation:
eject
USB Data Exports through LCD
Data can be exported directly from eGauge 4xxx meters using a USB mass storage device. These exports automatically contain day-granular data. All data from epoch (the date set in "Date and Time Recording Started" under Settings -> General Settings) until the date and time the export was initiated is copied.
To select a specific granularity or time range (or otherwise automate USB exports), an auto.run file must be created and loaded on the USB mass storage device (this article has more information).
To begin the process, insert a mass storage device formatted as EXT3 or VFAT. The "Storage Menu" will appear. Menu navigation is performed using the multiswitch button. Moving the switch left or right will change the selected option. Pushing the multiswitch in will confirm the selection. "Export data" should be highlighted by default. To begin the export, push the multiswitch in:

Once the export has begun, the screen will read "export started". The export process takes a variable amount of time depending on the amount of data present on the eGauge.

Once the export has finished, the screen will read "export finished". The "OK" option will be highlighted. Push the multiswitch in to acknowledge.

After acknowledging the export, the "Storage Menu" will appear again. Move the switch left or right until "Exit & Eject" is highlighted. Push the multiswitch in to select this option.

Once the main LCD menu appears, the USB mass storage device can be safely removed.
Formatting a USB stick on Windows 10
These instructions may not work for all versions of Windows and are provided as-is. eGauge Support cannot provide additional troubleshooting or support on formatting USB sticks. An adequate understanding of using the Windows operating system and file explorer may be necessary to complete these instructions.
This will permanently erase all data on the selected drive or USB stick. Incorrect usage can cause permanent data loss on the wrong drive.
1) Connect a USB stick to a PC running the latest version of Windows 10.
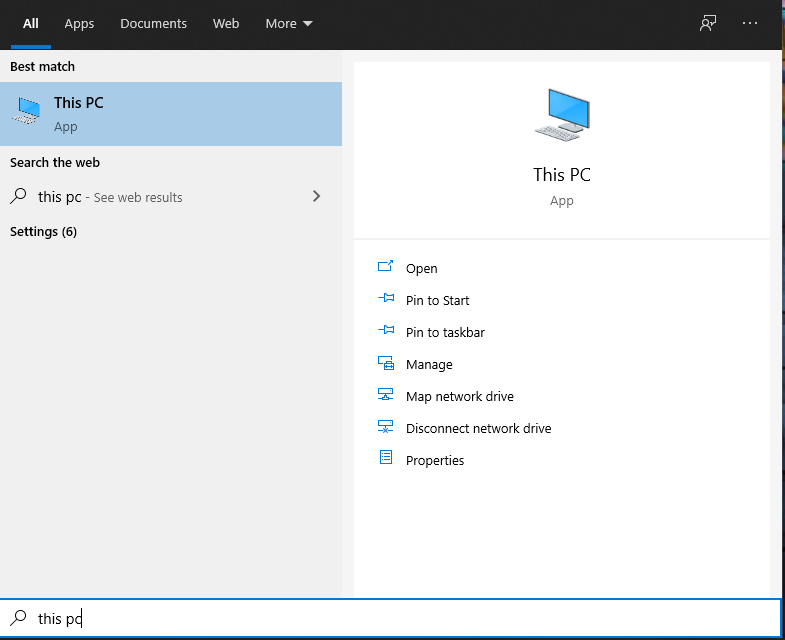
2) Click on the Start Menu and type in "this pc" and open the "This PC" app.
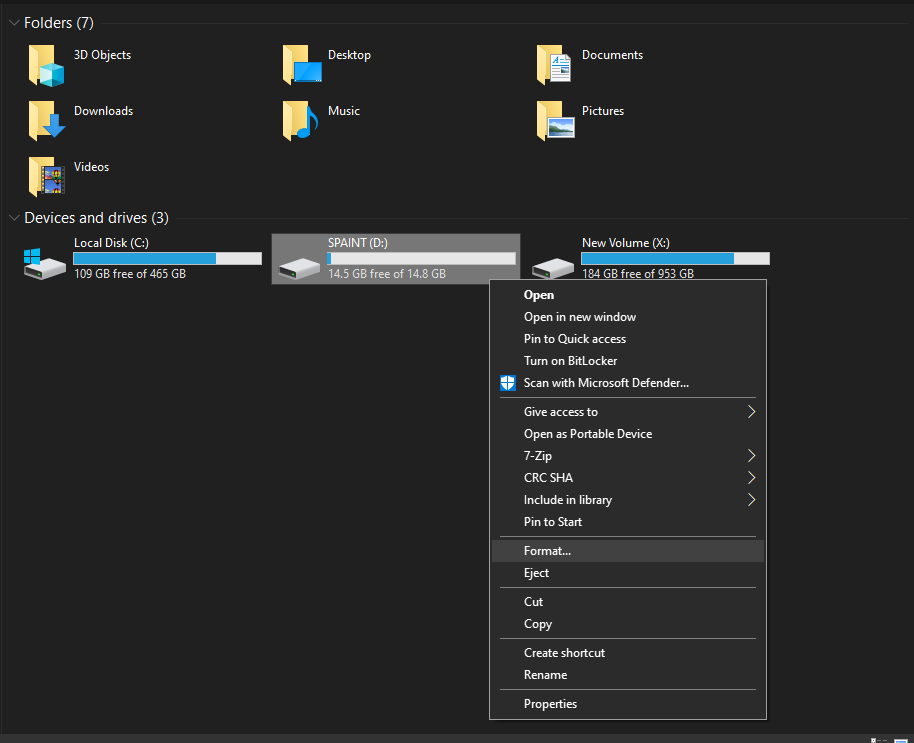
3) In the "This PC" window, right-click the USB stick and choose "Format..."
4) Ensure the "File system" is set to FAT32, and "Quick Format" is checked. The "Volume label" does not matter. Press "Start".

5) When complete, the USB stick is ready for use with an eGauge.
If copying files such as auto.run and fw.bin, open another explorer window to where the files are downloaded on your computer, and open the USB drive. Select the file(s) and drag the files to the explorer window of the USB stick.

6) After the files are copied, click the "back" button on the USB stick window, right-click the USB stick drive and choose "Eject".
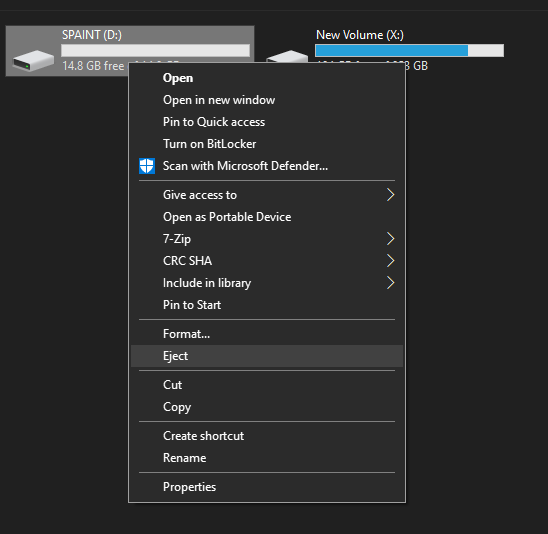
7) Remove the USB stick. It is now ready for use with the eGauge meter.
Alerts
All about eGauge Alert functionality
Configuring eGauge Alerts (Modern Interface method)
Firmware version 4.6 or newer is needed to set up eGauge device alerts in the Modern Interface. Please see this article for information on checking and upgrading your eGauge meter firmware.
To view and acknowledge triggered alerts, see the Alert Viewer article.
eGauge device Alerts
eGauge device Alerts allow the meter to log and send alerts that may be triggered off a variety of conditions, such as the meter's configuration being changed, a remote SunSpec device fault, or advanced custom alerts such as voltage being out of expected range.
Alerts are displayed in the Modern Interface using the Alert Viewer, and may be configured to be sent via email or HTTP POST with JSON-formatted data.
Accessing the Alert Setup
To access the Alert Setup page, from the main menu access Setup → Alerts:
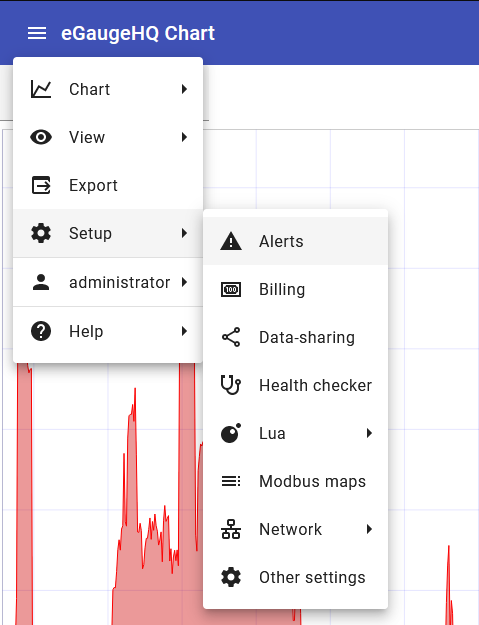
Setup sections
There are 3 main sections to configure for alerts:
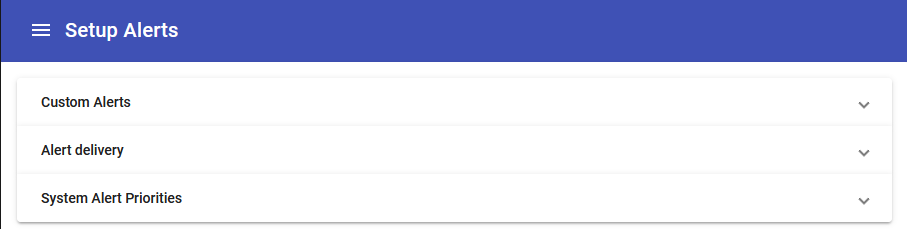
- Custom Alerts: These are custom, user-specified alerts. For example, a custom alert may be configured to trigger if total usage averages over 50 kW for a period of 15 minutes.
- Alert delivery: If emailing or sending alert data via HTTP POST, the destination and configuration may be set up here.
- System Alert Priorities: There are a number of built-in system alerts including device configuration changes or device reboots.
Custom Alerts
The Custom Alerts allows users to set up flexible alerts based on register data and other functions provided by the eGauge firmware. For a full list of available alert functions, visit /fundoc.html?alert on the particular meter (e.g., https://egaugehq.egauge.io/fundoc.html).
Click for more information

New custom alerts may be added by clicking the "add" button (1) at the top, existing alerts may be deleted clicking the "delete" button (2) to the right of the message, and any existing alerts may be modified by clicking anywhere on the custom alert line.
Create or Modify Alert
Be sure to save updated or new alerts by clicking "Save" in the lower right-hand corner of the page!
When editing an existing alert or creating a new alert, you may set information about the alert and the conditions required for it to trigger:

When creating or modifying an alert, there are 7 required fields to enter:
- Name: The unique name for an alert
- Priority: Priority level for the alert. For SMTP email alerts, once an alert-destination has been notified, only alerts of higher priority result in a new notification to that destination until the alert has been acknowledged or deleted via the alerts page.
- Check frequency: How often to check the alert condition. Note, the interval frequency starts at the top of the interval. E.g., hourly is evaluated at the top of the hour, daily is evaluated at midnight, monthly at midnight on the first of the month, and so on.
- Left formula: The left-hand side of the comparison formula. This may utilize register values, static numbers, and eGauge alert functions or custom Lua functions.
-
Operator: The operator to compare the left and right formulas. This may consist of:
- Less than (<): If the left formula is less than the right formula
- Less than or equal to (≤): If the left formula is less than or equal to the right formula
- Equals (=): If the left formula equals the right formula
- Not equals (≠): If the left formula does not equal the right formula
- Greater than (>): If the left formula is greater than the right formula
- Greater than or equal to (≥): If the left formula is greater than or equal to the right formula
- Right formula: The right-hand side of the comparison formula. This may utilize register values, static numbers, and eGauge alert functions or custom Lua functions.
-
Message: The alert message that is displayed in the Alert Viewer details and any email
alert messages. Several special variables may be used in the message:
-
%l: evaluated value of left formula -
%L: formula of left formula condition -
%r: evaluated value of right formula -
%R: formula of right formula condition -
%o: comparison operator of formula -
%%: percentage character
-
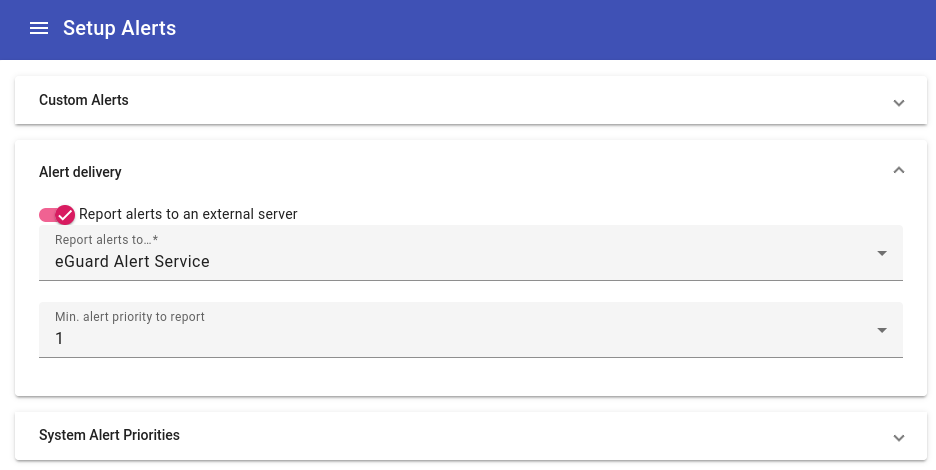
Alert Delivery
In addition to the Alert Viewer in the Modern Interface, the eGauge meter may send alerts via SMTP-direct email, HTTP POST, or email via the eGuard Alert Service. This is configured in the "Alert delivery" section of the Alert Setup.
Click for more information
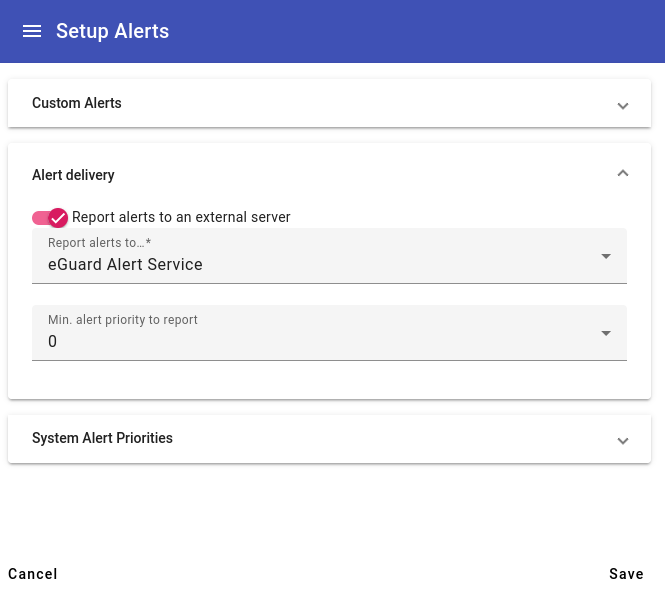
- Report alerts to an external server: If this is enabled, when an eGauge device alerts triggers, the meter will attempt to utilize the destination configured here.
- Report alerts to...: Select the appropriate service here. See the section below for details on the different options.
- Min. alert priority to report: Only alerts with a higher priority level than this will be reported when triggered. When using an SMTP email gateway, this option is set per-email destination.
Report alerts to....
There are currently 3 methods of externally reporting alerts. Click to expand information for a given external method:
eGuard Alert Service
The eGuard alert service provides an alternative to configuring the eGauge with SMTP credentials. This is especially useful for individual users that may not have SMTP login information available, as well as users with a large number of devices. The meter must be in an eGuard group controlled by the user.When alerts are triggered, the meter makes an outboune HTTPS POST to eGauge.net with the alert information, and in turn eGauge.net logs the alerts and sends an email to the user.
The only configuration option is Min. alert priority to report which is the minimum alert priority this destination should receive alerts for. For example, if all alerts are set to priority 0, an alert destination with a minimum alert priority of 1 will not receive any alert emails.
More information on eGuard is available here Also note that eGuard features built-in alerts - those are covered in this article.
Email Gateway (SMTP)
Valid SMTP credentials and server information is required for the email-direct method. Multi-factor authentication or other high-security network applications may prevent SMTP email alerts from functioning, so the eGuard Alert Service email method is recommended.

There are several options to configure:
- Custom "From" address: The From address to send the email from. If omitted, the From address defaults to the "User" configured below. This may be required if the "User" below is not a fully qualified email address.
- Relay host: The SMTP server to send the email through. If this is left blank, the eGauge will attempt to directly send the email to the alert destination's email domain. Warning: most email servers will reject emails sent directly without a relay host.
-
User: If a relay host is specified, this is the username that should be sent to the relay for
authentication. Note: some servers require the full
email@domainuser format, while others may only require theemailuser format. - Password: If a relay user is specified, this is the password that should be used to authenticate.
After configuring the server information, Alert destinations should be configured. Click on an existing destination to edit the information, or click the "Add" button in the upper right-hand corner of the table to add a new alert destination email.
When configuring a destination email, there are 3 options to configure:

- Email address: The email address to send triggered alert information to. This may or may not be the same as the SMTP relay user information configured previously.
- Min. alert priority: The minimum alert priority this destination should receive alerts for. For example, if all alerts are set to priority 0, an alert destination with a minimum alert priority of 1 will not receive any alert emails.
- Email format: The length of the email to send to the destination. The "full" format provides a fully detailed alert email, while "short" only provides the highest-priority limit to stay within 140 characters, such as for use with email-to-SMS gateway addresses.
A "Send email" button allows the testing of an outbound email to that particular email destination. If successful, the destination email will receive a test email from the meter. Warning: if no Relay Host and credentials are configured, outbound emails may not work all the time, even if an initial "Send email" test is successful.
custom
Custom alerts may be utilized by advanced users to send JSON-formatted data as an HTTP POST to a user-provided URL.
Several configuration options are available:
- Min. alert priority to report: The minimum alert priority this destination should receive alerts for. For example, if all alerts are set to priority 0, an alert destination with a minimum alert priority of 1 will not receive any alert emails.
- Custom URL: The URL to POST alert information when triggered.
-
Alert options: Any options to use when sending alerts. The available options are currently:
-
deflate: Use "deflate" content-encoding compression when posting alerts. -
gzip: Use "gzip" content-encoding compression when posting alerts. -
secure: For HTTPS connections, fail if the alert provider server's certificate cannot be verified.
-
Click for JSON format and example data
{
  "now": "1568419537.35",
  "alerts": [
    {
      "id": 1804290019,
      "priority": 7,
      "occurrences": 12,
      "first_occurence": 4462.5,
      "last_occurence": 389.31,
      "name": "Device-configuration changed",
      "detail": "By owner."
    },
    {
      "id": 1804290035,
      "priority": 0,
      "occurrences": 1,
      "first_occurence": 0,
      "last_occurence": 0,
      "name": "Device rebooted by firmware",
      "detail": "Howdy do?"
    }
  ]
}
-
nowis a 64-bit UNIX timestamp, possibly with a fractional (sub-second) part, formatted as a decimal integer string. -
alertsis a list of reported alerts: -
idis a number that uniquely identifies an alert. It is used, for example, to acknowledge or clear an alert. -
priorityis the user-assigned priority level of the alert (0 being the lowest priority and 7 the highest priority). -
occurrencesgives a count of how many times the alert has occurred since it was last cleared. -
first_occurenceandlast_occurencespecify how many seconds ago the alert occurred for the first time and the last time, respectively, relative tonow. That is, the specified number should be subtracted fromnowto get the absolute UNIX timestamp of when the alert occurred first and last, respectively. -
nameis the name of the alert that occurred. -
detailprovides additional detail on the alert that occurred.
System Alert Priorities
System alerts are always logged and can be viewed in the Alerts View. Priorities may only need to be changed if alerts are being sent to an external server configured in the Alert Delivery section.
There are a number of built-in system alerts including device configuration changes or device reboots.
In this section, the priority level of each system alert may be configured. For example, a user may have an unstable internet connection and may not want to be alerted whenever the proxy-connection is lost or re-established, but may want to be alerted about a remote device fault. In this case, the "Remote device fault" may be set at priority 1, while "Proxy-connection established" and "Proxy-connection lost" are set to priority 0. The alert destination, if set to a minimum priority level 1 will receive alerts for the remote device fault, but not for proxy-connection events.
Custom Alerts
For a full list of available alert functions, visit /fundoc.html?alert on the particular meter (e.g., https://egaugehq.egauge.io/fundoc.html).
eGauge Support has limited support for creating and troubleshooting custom alerts.
General Syntax
Custom alert formulas follow a logical expression format.
$"REG NAME" returns the instantaneous value of the register REG NAME, while "REG NAME"
points a function at a specific register (but doesn't return the register's value).
When using functions such as avg() or others listed in the function documentation,
be sure to use the correct format. E.g., a function expecting a "string"
will expect a quoted register name (e.g., "REG NAME") while a function expecting a number
(instantaneous register value) will expect the register's current value (e.g., $"REG NAME", with
the prefixed $).
Generic syntax examples:
| Expression | Description |
|---|---|
| 3+4*5 | Equals 23 |
| (3+4)*5 | Equals 35 |
| sqrt(9) | The square-root of 9 (i.e., 3) |
| $"Grid" | The instantaneous value of register Grid (e.g., 500 W) |
| (3>4) ? 3.14 : 10 | Conditional expression evaluating to 10 (as 3>4 is false) |
As this table shows, basic arithmetic operations with normal precedence rules are supported: multiplication/division have higher precedence than addition/subtraction. Parentheses can be used to override the normal precedence-rules. Various functions such as sqrt() (square-root) are also supported. The exact functions supported depends on the context.
Basic functions are supported in any expression, whereas certain Alert functions are available only in alert conditions. The value of a register can be obtained by enclosing its name in quotes (") and prefixing it with a dollar sign ($). Conditional expressions consist of 3 parts: the control-expression before the question-mark, the if-true-value after the question-mark, and the if-false-value after the colon. If the control-expression has a non-zero value, the conditional expression evaluates to the if-true-value, otherwise, to the if-false-value. All numeric values are represented as IEEE-754 single-precision (32-bit) float values. Limited recursion is supported with the depth of the evaluation stack limited to 128 entries.
L1 Voltage High
The following example checks every 1-second whether the register "Voltage L1" is greater than
or equal to 126. Note, this is a simple numerical calculation without any functions, so we
get the instantaneous value of the Voltage L1 register by prefacing it with an $ as
$"Voltage L1".

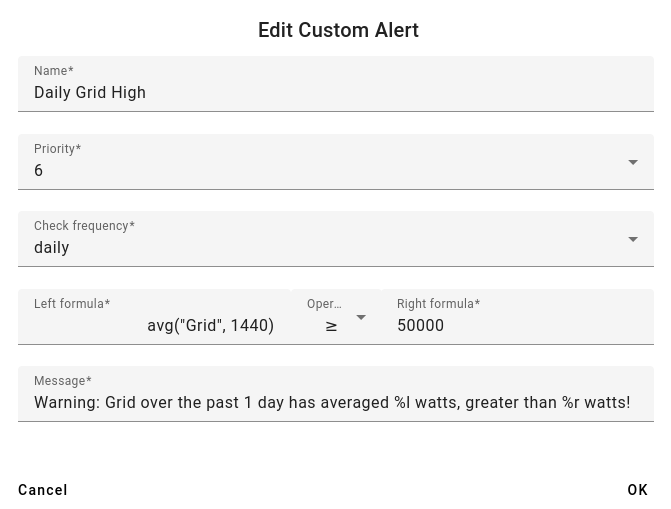
Daily Grid High
The following example checks every 1-day whether the Grid's previous day (1440 minutes) usage averaged
50 kW (50000 watts) or more. Note, the avg() function requires a register name, so we do not preface
the register name with an $.
Alerts and Email Gateway with SendGrid
Introduction
If delivering email to only one recipient, consider using the eGuard Alert Service to send device alerts as it is the easiest method for delivering email alerts.
You will need your own website's email address to send email from; Gmail, Yahoo, AOL and other public email services may not work with this method.
Compatibility Notice: Beginning in June 2023, only EG4xxx will be compatible with the SendGrid SMTP gateway. Legacy meters such as EG30xx and eGauge2 will fail to send alerts via the SendGrid SMTP gateway.
SendGrid is a free third party service unaffiliated with eGauge which provides a consistent outbound email delivery service. It can be used for eGauge alert delivery, and is more reliable than not specifying an "Email Gateway". Without an "Email Gateway" configured, alert emails may be rejected, dropped, or fail inconsistently.
It is intended as a commercial service for businesses rather than individual end users.
SendGrid allows up to 100 emails daily with the free plan.
SendGrid provides delivery information and monitoring such as email delivery failures, number of emails sent and other features.
Disclaimer
SendGrid is a third party email delivery service with no affiliation with eGauge Systems. eGauge Systems cannot guarantee email delivery, uptime, or security of using SendGrid.
Information on this page will be updated on best effort level. Information including pricing, set up instructions, screenshots, and locations of items are not guaranteed to be up to date or consistent.
eGauge Systems does not provide any support for SendGrid's services, and cannot assist with account creation, password recovery, or similar issues.
Pre-setup notes
Email can be delivered from the eGauge meter using SMTP server smtp.sendgrid.com and a sendgrid API key.
If using alerts on multiple devices, it is advised to set up a unique API key for each one, so that if the key becomes compromised or the meter becomes inaccessible and alerts cannot be disabled, the API key can be revoked for only that meter.
API keys are passwords and are displayed only once after creation.
Setup
- Set up API keys:
Initial account creation and setup wizard for first email
or
Adding a second API key, or adding without the wizard from the main dashboard - Verify a sender identity
- Configure the eGauge meter
Initial account creation and setup wizard for first email
- Create an account at https://sendgrid.com/
- Click "Start" to the right of "Integrate using our Web API or SMTP relay"

- In "Choose a setup method", choose "SMTP relay"

- Give the API key a name, like "eGauge Alerts Emails" and press "Create Key"

- You will now be given the SMTP server (smtp.sendgrid.net), the username (apikey), and password (hidden). This is the only time the password will be displayed, it should be saved somewhere securely like an encrypted keychain if it will be used more than once. Keep this page open or copy the password as it will be used in a later step.

Adding a second API key, or adding without the wizard from the main dashboard
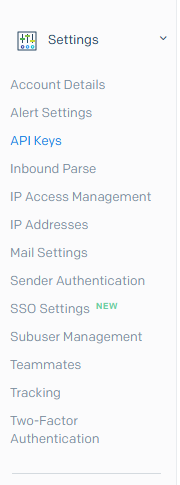
- In the main dashboard on the left-side menubar, expand Settings and click API keys.

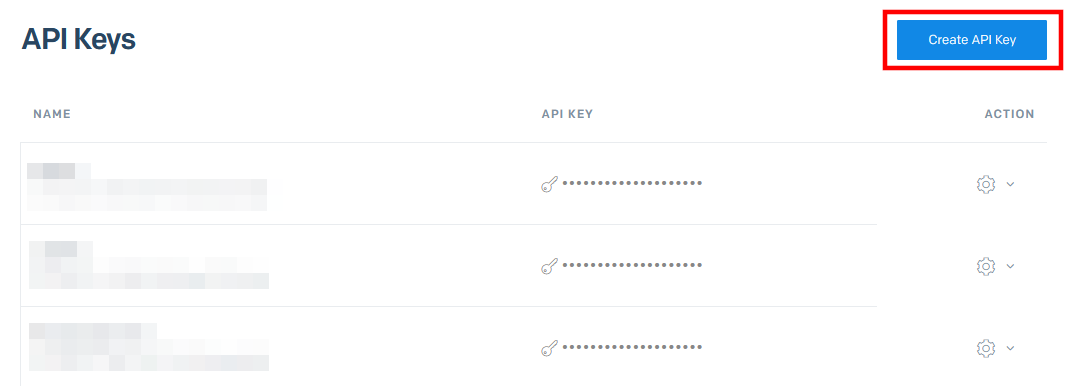
- Click "Create API Key" in the upper right-hand corner:

- Choose "Restricted Access" as the API key permissions, expand the "Mail Send" section, and click the dot on the right side of the bar next to "Mail Send" to grant that permission

- Click "Create and View", and copy the API key displayed on the next screen. This will be used to configure the eGauge meter in a later step.

Verify Sender Identity
You will need to set up Sender Authentication so the receiving email server trusts and accepts the email the eGauge meter delivers. Follow the instructions for Single Sender Authentication (simple: sends an email link to verify email address) or Domain Authentication (advanced: requires modifying DNS entries on your website).
Without sender authentication, you will see an error such as The from address does not match a verified Sender Identity when sending a test email without verification completed. It will contain a link with information to set up sender authentication.
The email address you verify will be used in the Custom "From" address setting in the eGauge meter alert settings.
Configure the eGauge Meter
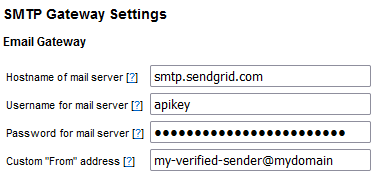
- Navigate to Settings -> Alerts, ensure "Alert Provider" is set to "SMTP Gateway" and click on "View/Edit Gateway & Alert Destinations". Enter the mail server hostname (
smtp.sendgrid.com), username (apikey), and the API key / password that was created previously. For the Custom "From" Address, enter an email identity verified in the previous step.
- Enter the email address(es) that should receive alerts from the meter under Alert Destinations.

- Press "Save" at the bottom of the page, and then "Send Test Message" to the right of each Alert Destination to ensure the delivery works.

Configuring eGauge Alerts (Classic Interface method)
Firmware version 4.6 and newer can have alerts configured through the Modern Interface.
Overview
The eGauge can be configured to send alerts based on a variety of trigger conditions. Alerts must be configured through the eGauge interface, and the eGauge needs to be powered on and connected to the internet in order to send alerts. There are three possible alert destinations: SMTP (email or SMS-capable phone numbers via an email-to-SMS gateway if the cellular provider supports), the eGuard alert service, or a custom URI for a JSON POST (advanced users).
SMTP emails credentials may be supplied, and the eGauge will use this email account to generate alerts. Some services such as Gmail may restrict logins to browsers, or disallow the login if devices in different locations are attempting to all log in to send alerts. For large larger deployments a service such as SendGrid may be used.
The eGuard Alert Service is a more simplified email alert delivery service and only requires you have an eGauge.net account.
The following article covers basic alert configuration and provides some sample alerts. Additional information is available on an eGauge-specific basis by navigating to http://DEVNAME.egaug.es/fundoc.html?alert where DEVNAME is the device name of your specific eGauge. To take advantage of all alert features, the eGauge should be on the latest firmware.
For meters shipped after January 1, 2024 this information may be found at: http://DEVNAME.egauge.io/fundoc.html?alert
Contents
Configuring the Alert Service Provider
Viewing and Acknowledging Alerts
Example and description of POST data
Alert Basics
Alerts may be configured from the Settings → Alerts page and viewed from View → Alerts. There are two types of alerts: system alerts and user-defined alerts. System alerts can report conditions such as when the device configuration is changed or when the connection to a remote device has been established. User-defined alerts are built arbitrary conditions that, when true, trigger the alert. For example, you could define an alert that triggers when solar production for a period is below a certain threshold value, or an alert that triggers when the register monitoring Oven usage has been above a certain value for a certain time. More examples are available here.
Configuring the Alert Service Provider
Choose the View/Edit Gateway & Alert Destinations button from the top of the Alerts page to configure how alerts are sent. The page will request credentials in order to make changes if none have been previously cached.
SMTP Gateway
Legacy meters (eGauge2 and EG30xx series) support TLS 1.1, while newer meters (such as EG4xxx) support TLS 1.2.
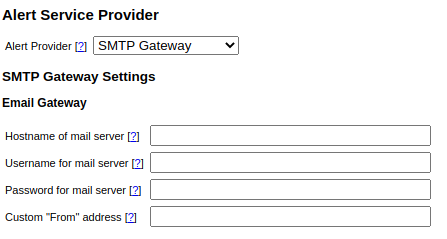
The SMTP Gateway Alert Service Provider allows the eGauge to send alerts directly to email addresses, SMS-enabled phones, or a mixture of the two. This functionality requires an internet connection, but does not require the eGauge to be connected to the proxy server at d.egauge.net. The following fields are required:
Hostname of mail server
Normally, eGauge attempts to deliver email directly to the destination address. Similarly, it attempts to deliver SMS directly to an SMS-gateway. However, if a firewall prevents the device from directly establishing such connections, as is commonly the case for consumer-grade Internet-service, you will have to set the value of this setting to the hostname of a mail server which can forward the messages to the final destination. The mail server may either be a host on the same LAN (e.g., within a company or school network) that will accept email delivery without authentication or it may be am external mail server where you have a valid user account. By specifying the username and password for that account, the device is then able to deliver email through that mail server (ie, the alert messages from the eGauge will originate from your username on that mail server). As an example, if you have a Gmail account, you can set the hostname to smtp.gmail.com. By specifying your Google account’s username and password, you can then have alerts delivered via Gmail.
Username for mail server
When non-empty, this setting specifies the username the device uses to authenticate itself to the mail server. If empty, mail is delivered without authentication. Note that this option is required for almost all mail servers.
Password for mail server
This setting specifies the password the device uses to authenticate itself to the mail server. It is used only if Username is not empty.
Caution: on legacy meters (eGauge2 and EG30xx series) the password is transmitted to the eGauge over an unencrypted channel. Only change this password from a computer that’s connected to the same LAN as the eGauge and only after clicking on the LAN Access link on the eGauge main page. As an added security measure, create a dedicate email account at the mail server for sending eGauge alerts.
Using SendGrid
Compatibility Notice: Beginning in June 2023, only EG4xxx will be compatible with the SendGrid SMTP gateway. Legacy meters such as EG30xx and eGauge2 will fail to send alerts via the SendGrid SMTP gateway.
SendGrid credentials are entered in the SMTP Alert Service Provider fields. For more information on using SendGrid or a similar service, please refer to this article.
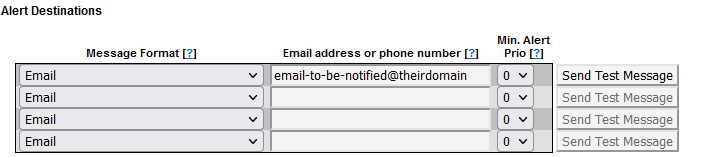
Setting Alert Destinations
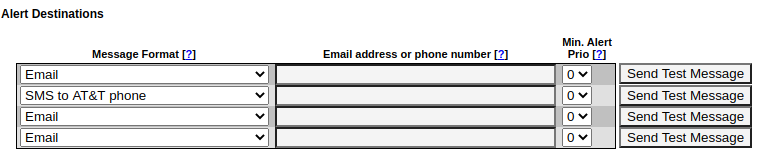
Message Format: select the appropriate SMS carrier or email format.
Email address or phone number: enter the appropriate destination for the alert.
Min. Alert Prio (Minimum Alert Priority): minimum level of alerts this destination should receive (see below).
Up to four alert-destinations can be defined. Alerts are prioritized. For each alert-destination, a minimum priority can be defined. Only alerts whose priority is equal to or greater than the minimum priority are reported to an alert-destination. Once an alert-destination has been notified, only alerts of higher priority result in a new notification to that destination until the alert has been acknowledged or deleted via the alerts page, or after 24 hours have passed.
eGuard Alert Service
Legacy meters (eGauge2 and EG30xx) require HTTPS certificate validation to be disabled to activate the eGuard Alert Service. This is due to a bug with an older SSL library used on legacy meters and the eGauge.net certificate provider. This should only be used if the alert information being sent is not sensitive.
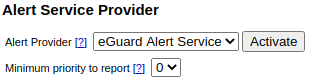
The eGuard alert service provides an alternative to configuring the eGauge with SMTP credentials. This is especially useful for users with a large number of devices. The meter must be in an eGuard group controlled by the user. More information on eGuard is available here. Also note that eGuard features built-in alerts - those are covered in this article.
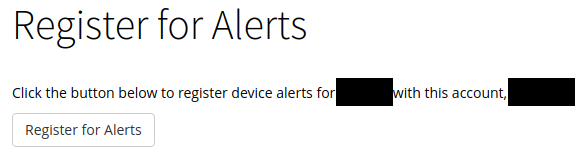
To use the eGuard Alert Service, simply select "eGuard Alert Service" and click the "Activate" button. A new window will open, and you will be prompted to log in to eGuard. Once logged in (or if you are already logged in), eGuard will confirm you want to register this device for alerts. Click "Register for Alerts" to confirm.
Minimum priority to report: Setting this to a value other than zero will omit any alerts with a priority set lower than that value. This can be useful when certain alerts are not required (eg, set all system alerts to zero, set minimum priority to report to 1, then set all user-defined alerts to 1).
Custom Alert Destinations
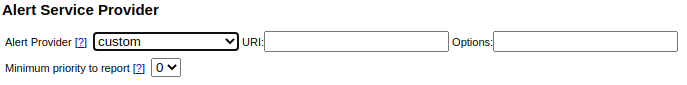
Custom alerts may be utilized by advanced users to send JSON-formatted data as a POST to a user-provided URI (alert destination).
Alert Provider: Must be set to "custom".
URI: The URI to send the JSON POST to. Should be unique to the device, such as with a GET token to uniquely identify the device making the POST.
Options: A comma separated list of options available below:
- deflate: Use "deflate" content-encoding when posting alerts.
- gzip: Use "gzip" content-encoding when posting alerts.
- secure: For HTTPS connections, fail if the alert provider server's certificate cannot be verified as being valid.
Do not use multiple compression schema, i.e., do not use gzip AND deflate on the same device.
Minimum priority to report: All alerts with a priority level equal to or greater than this will be POSTed to the URI when triggered. To prevent some or all system alerts from being reported, this may be set to "1" or greater. When alerts below the minimum priority level are triggered, they are only logged on the device locally and do not create a POST.
An example of the JSON post contents is available here.
Configuring Alerts
Alerts are reported with a delay of approximately 30 seconds and are automatically acknowledged 24 hours after reporting them. These rules ensure you will be promptly informed of any alert conditions for a device without a deluge of SMS or email messages. Alerts of higher priority are reported even if there are pending alerts of a lower priority.
There are two types of alerts: System alerts and User-defined alerts
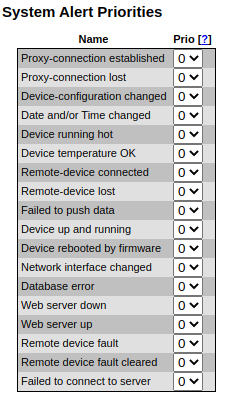
System Alerts
System alerts are predefined but you can choose the priority with which they are reported. This allows control over which recipients receives which system alerts (if any) and which alerts are more important. To set an alert priority, use the dropdowns in the "Prio" column. If there are certain system-alerts that you do not wish to have reported at all, select priority 0 and ensure that all alert destinations have a minimum alert priority of at least 1. Note that alerts with a priority of 0 will still be logged on the Alerts page, but no notifications will be sent for those alerts if all alert destination priorities are higher than 1.
Proxy-connection established/lost: tracks when a connection to the proxy server at d.egauge.net is opened or closed. If this occurs frequently it can indicate an unstable network connection.
Device-configuration changed: reports when a device’s configuration is changed, and which account has made the modification.
Date and/or Time changed: reports when the device date or time is changed (either by the user or automatically).
Device running hot: reports if the eGauge’s internal temperature reaches a significantly high temperature.
Device temperature OK: reports when the eGauge’s temperature returns to a safe level.
Remote-device connected: tracks when a connection is established to a remote device (including Modbus devices and remote eGauges).
Remote-device lost: tracks when a connection to a remote device is lost (including Modbus devices and remote eGauges).
Failed to push data: reports if a data push is set, and the eGauge is unable to successfully push data.
Device up and running/Device rebooted by firmware: tracks when the meter is rebooted, and when the meter comes back online from a reboot or power outage.
Network interface changed: tracks when the meter switches from an Ethernet (ETH) to HomePlug (PLC) connection. This may happen immediately after a reboot and can generally be ignored.
Database error: typically reports when the device configuration is changed. The occasional database error is considered normal, but if this alert triggers multiple times per day and no configuration changes are being made it may indicate an issue. If this happens, contact eGauge support at support@egauge.net.
Web server down/Web server up: reports when the eGauge's internal webserver stops and starts. This will generally happen as the result of a reboot, and may happen as a normal occurrence during regular operation (for example, watchdog resets). If this alert triggers multiple times per day for several days it may indicate an issue.
Remote device fault/Remote device fault cleared: reports when Sunspec fault codes trigger on a remote Modbus device, and when those fault codes are cleared.
Failed to connect to server: reports when certain outbound connections fail, typically alert POSTs when using a custom alert destination.
User Defined Alerts
User-defined alert patterns allow the flexible detection and reporting of various conditions. For example, an alert could be defined which, on a second-by-second basis, checks whether a register value is outside of its permitted range (e.g., whether a voltage or frequency is above or below a certain threshold).
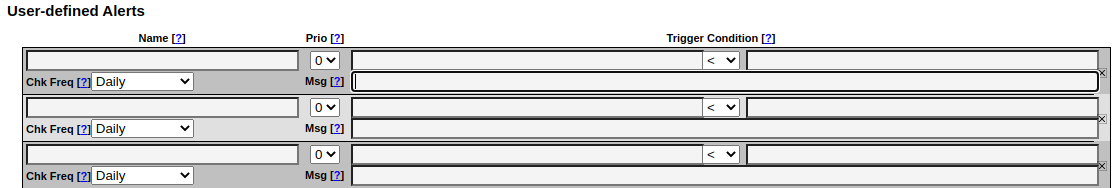
The alert fields are described below:
Name: The name of the alert. This should be short but informative enough to convey the nature of the alert.
Trigger Condition: The trigger condition consists of three parts: left-hand-side (lhs), comparison operator, and right-hand-side (rhs). The comparison operator may be one of less-than (<), less-or-equal (<=), equal (=), not-equal (!=), greater-orequal (>=), or greater-than (>). The lhs is compared to the rhs based on this operator and, if true, the alert is triggered.
Chk Freq (Check Frequency): select the frequency with which the trigger condition is to be checked. eGauge evaluates all alert conditions whenever the device starts up and hence may evaluate the conditions more frequently than requested. Apart from the first time a condition is checked on start up, hourly conditions are evaluated during the first minute of each hour, daily conditions during the first hour after midnight, weekly conditions during the first hour of Sunday, monthly conditions during the first hour of the first day of the month, and annual conditions during the first hour of the first day of the year. “Every second” conditions are evaluated each second, “Every minute” conditions once a minute.
Choose the lowest check frequency possible as evaluating too many conditions too often may slow down the device. If a slow-running condition (eg, a condition using the peak_risk() function) is evaluated, evaluation of other conditions may be delayed until the evaluation of that condition is completed.
Msg (Message): use this field to define a custom-message to be displayed along with the alert name. If left empty, a default message is included which shows the value of the lhs, the operator, and the rhs of the trigger-condition. A well-written message will explain the alert - for example, on a "Low Production" alert the message might be "Caution: Low production on Inverter 1 (north side)". The placeholders %l and %r can be used in the message field to include the calculated value for the lhs and rhs of the equation.
Examples of user-defined alerts are available in the User-defined Alert Examples section near the end of this document. Click here to jump to that section.
Viewing and Acknowledging Alerts
You can view and acknowledge alerts on your device under View → Alerts. By default, a list of triggered alerts will be visible. For more information on each alert and the option to acknowledge or delete an alert, click the "View Privileged Details" button.
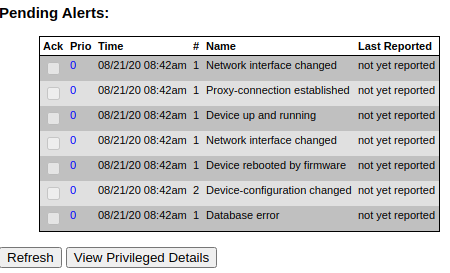
Ack (Acknowledged): indicates if this alert has been acknowledged. Once acknowledged, the alert will be reported again should it reoccur and its priority is sufficiently high. Alerts are automatically acknowledged after 24 hours. To ensure new alerts are reported, alerts should be acknowledged when they are received.
Prio (Priority): the priority of the corresponding alert.
Time: date and time of the most recent occurrence of the alert.
#: number of times this alert has occurred (note that this isn't necessarily the number of times the alert has occurred since the device was installed).
Name: name of the alert.
Last Reported: date and time when the alert was last reported to at least one of the alert-destinations.
To view detailed alert information as well as acknowledge and delete reported alerts, click the "View Privileged Details" button. Valid credentials are required to see this information and acknowledge/delete alerts.
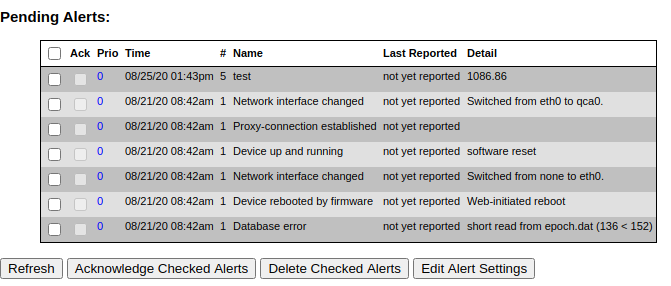
The Detail column contains additional information about each alert. For example, one instance of the "Network interface changed" alert provides the additional detail that the network interface was changed from "none" to "eth0" (this happens immediately after a reboot) while the other (newer) instance of the "Network interface changed" alert provides the additional detail that the network interface changed from eth0 to qca0. This happened very quickly (within the same minute), and is normal behavior for a meter coming back online after a reboot.
To modify alerts, check off any alerts you wish to delete or acknowledge, and click the appropriate button. Deleting alerts here
will remove them from the reported alert page until it occurs again.
User-defined Alert Examples
For available functions on your particular firmware version, visit http://DEVNAME/fundoc.html?alert where DEVNAME is your eGauge device name.
General Notes
$"REG NAME" returns the instantaneous value of the register REG NAME, while "REG NAME" points a function at a specific register (but doesn't necessarily return the register's value). When using functions such as avg() or others listed in the function documentation, do not include the dollar sign.
When creating a message (Msg), there are several shortcuts which can be used to include values from the alert condition itself:
%l will return the value of the left–hand–side%L will return the formula of the left–hand–side%r will return the value of the right–hand–side%R will return the formula of the right–hand–side%% will return a single percent sign (eg, %l %% would read as <value from left side of the comparison> %)
Basic Examples
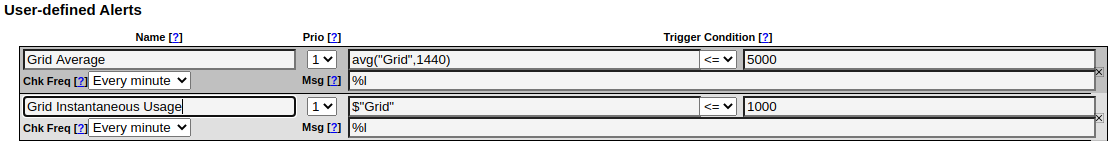
In the following example, "Grid Average" will return the daily average of the Grid register if that value is less than or equal to 5000W, while "Grid Instantaneous Usage" will return the instantaneous reading of the Grid register if that value is less than or equal to 1000W.
The next example will trigger if the value of the L1 voltage register is greater than or equal to 130V (which could indicate a dangerous condition for devices connected to that service).

More complex math can also be performed on either side of the alert expression. For example, the following alert obtains the average voltage from two references, and triggers if that value is greater than or equal to 130V.

It's also possible to calculate cumulative values (kWh) over a period and trigger an alert based on those values. In the following example, let's assume an outdoor hot tub has a 6kW pump/heater, which cycles every 3 hours for 30 minutes at a time. Thus, every 6 hours there should be 6 kWh of energy used. Any less could indicate a pump or heater failure, and the hot tub could freeze.
(avg("Hot Tub Pump/Heat",360)*6) / 1000 will take the average power (W) read on the register Hot Tub Pump/Heat over the last 360 minutes (60 minutes in an hour, 6 hours). Then, the average power is multiplied by 6 hours to get Wh, the total energy used over the 6 hour period. Finally, we divide by 1000 to convert Wh to kWh.
That value is then compared to the value on the right-hand-side, in this case 6. If the alert is triggered the alert will be sent.

Ternary operator
The syntax of the “?” ternary operator (also referred to as a conditional or conditional test) is condition?value_if_true:value_if_false and can be nested. This is a fundamental component of many alerts, especially more complex alerts.
Boolean expressions
Simple boolean expressions may be used within an alert:
(5 > 4) will return 1. Conversely, (5 < 4) will return 0.
The boolean value can be multiplied by another value (including a register value). For example, ($"Grid" < 7000) * $"Grid" returns the value of “Grid” if “Grid” is greater than 7000 W, and returns 0 if the value of "Grid" is less than 7000W.
To break this down: if $"Grid" < 7000 is true, it will return a 1. 1 * $"Grid" returns the value for the "Grid" register. If $"Grid" < 7000 is false, it will return a 0. 0 * $"Grid" is 0. Remember, $"REGNAME" returns the instantaneous value of the register.
Let's look at how the time() function can be used with the ternary operator and boolean expressions to trigger an alert at a specific time:
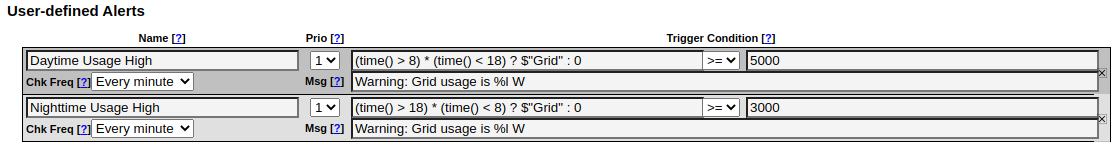
These two alerts work together to trigger if the Grid value is greater than 5000W during daytime hours and greater than 3000 during nighttime hours.
time() returns the current time as a number from 0 up to (but not including) 24 with minutes as a fractional value. For example, 11:30am would be 11.5. We use two booleans here:
time() > 8 * time() < 18
If the time is > 8 (8am) and less than 18 (6pm), the booleans work out to 1 * 1 or 1.
If either boolean is false, the output from the booleans is 0. 0 * 1 or 1 * 0 both equal 0.
This gives us a ternary expression of either 1 ? $"Grid" : 0 or 0 ? $"Grid" : 0 (remember ternary expressions work out as condition?value_if_true:value_if_false). Thus, if the booleans evaluate to 1, the left side of the formula returns the value of $"Grid". If the booleans evaluate to 0, the left side of the formula returns 0.
Moving on to the alert expression: if the booleans work out to zero (ie, if the time range is not correct), the left side of the alert returns 0. This can never be greater than 5000, so the alert never triggers. If the booleans work out to 1, the left side of the alert returns the value of the "Grid" register. If the value of the "Grid" register is >= 5000, the alert triggers.
Example and description of POST data
{
  "now": "1568419537.35",
  "alerts": [
    {
      "id": 1804290019,
      "priority": 7,
      "occurrences": 12,
      "first_occurence": 4462.5,
      "last_occurence": 389.31,
      "name": "Device-configuration changed",
      "detail": "By owner."
    },
    {
      "id": 1804290035,
      "priority": 0,
      "occurrences": 1,
      "first_occurence": 0,
      "last_occurence": 0,
      "name": "Device rebooted by firmware",
      "detail": "Howdy do?"
    }
  ]
}
-
nowis a 64-bit UNIX timestamp, possibly with a fractional (sub-second) part, formatted as a decimal integer string. -
alertsis a list of reported alerts: -
idis a number that uniquely identifies an alert. It is used, for example, to acknowledge or clear an alert. -
priorityis the user-assigned priority level of the alert (0 being the lowest priority and 7 the highest priority). -
occurrencesgives a count of how many times the alert has occurred since it was last cleared. -
first_occurenceandlast_occurencespecify how many seconds ago the alert occurred for the first time and the last time, respectively, relative tonow. That is, the specified number should be subtracted fromnowto get the absolute UNIX timestamp of when the alert occurred first and last, respectively. -
nameis the name of the alert that occurred. -
detailprovides additional detail on the alert that occurred.
Example and description of JSON alert POST data
{
  "now": "1568419537.35",
  "alerts": [
    {
      "id": 1804290019,
      "priority": 7,
      "occurrences": 12,
      "first_occurence": 4462.5,
      "last_occurence": 389.31,
      "name": "Device-configuration changed",
      "detail": "By owner."
    },
    {
      "id": 1804290035,
      "priority": 0,
      "occurrences": 1,
      "first_occurence": 0,
      "last_occurence": 0,
      "name": "Device rebooted by firmware",
      "detail": "Howdy do?"
    }
  ]
}
-
nowis a 64-bit UNIX timestamp, possibly with a fractional (sub-second) part, formatted as a decimal integer string. -
alertsis a list of reported alerts: -
idis a number that uniquely identifies an alert. It is used, for example, to acknowledge or clear an alert. -
priorityis the user-assigned priority level of the alert (0 being the lowest priority and 7 the highest priority). -
occurrencesgives a count of how many times the alert has occurred since it was last cleared. -
first_occurenceandlast_occurencespecify how many seconds ago the alert occurred for the first time and the last time, respectively, relative tonow. That is, the specified number should be subtracted fromnowto get the absolute UNIX timestamp of when the alert occurred first and last, respectively. -
nameis the name of the alert that occurred. -
detailprovides additional detail on the alert that occurred.
Zero out data/spikes tutorial
Devices on firmware older than version 3.01 may experience a phenomenon where register configuration changes that require a reboot cause unusually high readings to appear in the minute following the change. These readings are referred to as spikes, since they tend to "spike" far above the actual device readings. Spikes are almost always at least 100x the expected reading, and may be even higher.
Since spikes can cause cumulative readings to display incorrectly, the eGauge has a tool that can permanently clear data from the device database. Extreme caution should be exercised when using this tool. Once data is erased, it cannot be recovered. The video tutorial below provides a walkthrough of the tool's functionality.
Note that this tool may be used in other situations where clearing data is necessary (for example, removing bad data due to a configuration issue). However, this tool will always permanently clear data when used.
eGauge language options and adding new languages
The EG30xx and EG4xxx have support for different locales. The eGauge will use the language associated with the locale that is requested by the user's browser. If the locale does not exist or is not supported, it will default to English.
New locales and improvements upon existing ones are welcome. Please see our internationalization (I18N) page at https://www.egauge.net/i18n/ for full details. This page also shows the completion percentage of any supported language. Anyone is welcome to download and improve upon the PO files and submit them to i18n-team@egauge.net for review and implementation.
A specific locale can be forced to display in the browser by changing the browser's language/locale setting. Check your browser's help menu for information on changing your its language settings.
High Gain Mode
High-gain mode is available on the EG4xxx hardware only. To enable high-gain mode, navigate to Settings -> Installation. Check the "Use high-gain mode" option just above the dropdown menus for CT selection.

High-gain mode selection box
High-gain mode amplifies the incoming signal from all CTs by a factor of ten. From a practical standpoint, this means a CT with a higher amperage rating can be used to accurately measure much lower amperages. For example, with high-gain mode enabled a 100A CT could be used in place of a 10A CT.
High-gain mode does not require any changes to standard installation or wiring procedure. When high-gain mode is enabled, the CT amperages displayed in the drop down menus will decrease by a factor of ten (for example, an 800A CT will be listed as an 80A CT). For the simplest configuration, it is recommended to set actual CT amperages first and then enable high-gain mode. Note that high-gain mode is a global setting - when enabled, it applies to all configured CTs. As with most other installation settings, enabling high-gain mode will only impact data recorded from that point moving forward.
Connecting via the eGauge proxy server using IE 10/11
Users with Internet Explorer 10 and 11 may require some additional steps to function properly with the eGauge proxy server. These steps are covered in the document below.
|
|

Monitoring High Voltage Systems
Warning: Systems greater than 600V phase-to-phase are not fully supported by eGauge Systems. Supported CTs are rated for up to 600Vac, systems at higher voltages will need to source alternate CTs.
Amperage-output CTs (e.g., 5A output, or 100:5 ratio, etc) can cause serious shock or electrocution. Use appropriate protection when installing and handling equipment. Amperage-output CTs must not be connected directly to the eGauge meter and may cause damage.
Monitoring High Voltage Systems
Voltage Reference
eGauge Systems cannot guarantee meter accuracy when third party potential transformers are used. It is recommended to use the EV1000 high voltage sensor when measuring a system with higher voltage than the eGauge meter rating, or on a different side of a transformer from where the eGauge voltage taps are connected.
Amperage Reference
Necessary Hardware
Summary
Formula registers and remote devices
Physical registers represent any single data point recorded by an eGauge meter. These can come from locally-obtained raw measurements (eg, amperage or voltage), locally obtained calculations (eg, real power and other power register subtypes), and even registers imported from remote devices (remote eGauge or third party devices connected via Modbus TCP/RTU).
Formula registers are a type of physical register which can be used for a variety of calculations. Typically, a formula register will read data from one or more physical registers on a device, perform some calculation, and then store a new value. This is commonly used for advanced calculations such as power factor or reactive power.
However, when using a formula register with a remote register, some additional consideration must be taken to avoid incorrect values when the remote register is not available (eg, the remote device has been disconnected from the network, dropped offline, etc). When this happens, the remote register may return a "NaN" value (Not a Number) instead of a numerical value, which can "break" the formula register. Consider the simple example below:

In this example, a formula register is used to add together the physical registers "Local_Power" and "Remote_Power". "Local_Power" is a power register measured by the meter itself, while "Remote_Power" is a power register imported via Modbus from an external source.
Normally, this is simple addition: if "Local_Power" = 10 and "Remote_Power" = 20, the value of "Remote and Local Power" would be 30. However, if the remote device which provides a value for "Remote_Power" goes offline, the eGauge is now reading 10 + NaN, which returns NaN. This behavior isn't desirable - it would be much better to at least return the value of "Local_Power" (10).
To achieve this, we can use a conditional and a function to convert any returned "NaN" into a 0.
A conditional is expressed as X?Y:Z, where X is something that evaluates to True or False, Y is the value returned if X is true, and Z is the value returned if X is false. For example, (3=4)?0:1 would return 1, because 3=4 is false (3 does not equal 4).
The function isnan() takes one value in the parenthesis and returns a "True" if the value is NaN and "False" if the value is a number. For example, isnan(1) would return "False", because 1 is not a NaN. isnan(sqrt(-1)) would return "True", because sqrt(-1) (square root of -1) isn't a number (and is therefore NaN).
As you can see, isnan() will return either a "True" or "False". We can feed that into our conditional and dictate which value is returned. The basic form for this is:
isnan($"registername")?0:$"registername"
If the value of the register "registername" is a NaN, isnan() returns "True" and the conditional returns 0. If the value of the register "registername" is not a NaN, isnan() returns "False" and the conditional returns the value of "registername".
Using our original example:

Register ID and location
The eGauge uses "registers" to record data. Each register is an independent data point. For example, one register may be recording the voltage of L1, and another register can be recording the power of CT1*L1. Data is only recorded and stored if a register is configured to record it.
Each register has an ID which can be found in the Settings -> Installation page by hovering the mouse over the [x] delete button to the right of the register name:
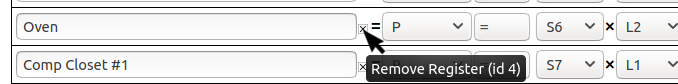
This shows register "Oven" is recording in ID #4.
If there are multiple power sub-types selected, multiple IDs will appear in order:
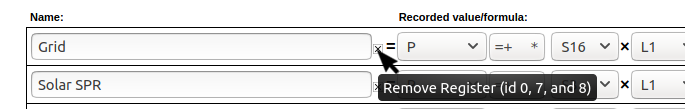
Grid is recording net power (=), positive-only (+) and apparent power (*). They are recording in ID #0, #7, and #8 respectively.
Adding a new register will use the first available unused ID, so if register ID #0 is removed and a new register is added, the new register will record in ID #0. Historical data is not erased when a register is removed, so historical data from ID #0 will always show in ID #0 even if the register is deleted and a new register records data in it.
To permanently erase data from a register, you can use the Zero-out data tool in the Tools menu.
Working With Max Demand Export Data
Overview
As of firmware version 3.1.10, the eGauge supports rolling max demand exports through the CSV export function built into the main graph page. These exports contain a rolling average over the past X minutes with a data point presented at the interval requested when creating the export.
Many utilities bill based on rolling max demand averages in additional to total kWh consumption. While it's possible to obtain a rolling max demand average using minute-granular data from a meter, the process is involved and the data overhead is quite large (data for every minute over the period must be downloaded, then the user must calculate a set of rolling averages for each interval, and record the maximum average for an interval). For example, a rolling max demand export over the past 30 days would return 2880 data points (one point every fifteen minutes), while a minute-granular export for the same period would contain 43200 data points (one point every minute).
eGauge Systems cannot assist with utility reconciliation or questions about the billing process used by a specific utility. You'll need to reach out to your utility for assistance with this.
Verifying Settings
The max demand export calculates a rolling average which is X minutes long. X is defined by the value selected for "Length of a demand interval" under Settings -> Preferences.
![]()
This value can be adjusted in one minute increments, from 15 to 60 minutes. Your utility should make their demand interval public (although it may be necessary to contact the utility directly to get this information). eGauge Systems cannot advise as to the correct value to select for this option.
Performing An Export
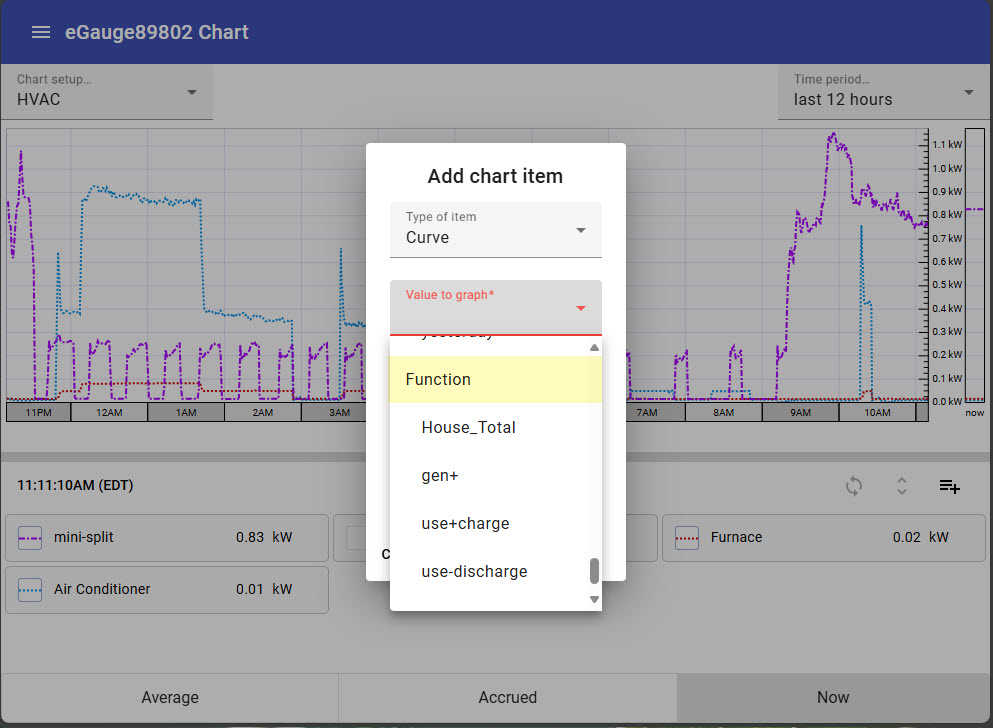
To perform a max demand export, use the dropdown menu in the top left corner of the main graph page. The export window should look something like the following image. Note that the export type is set to "Max. Demand Value" and the interval is set to 15 minutes.
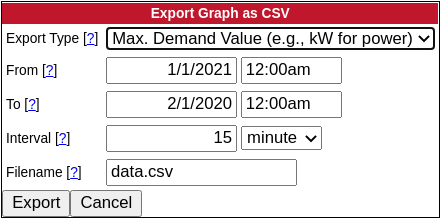
The export interval setting is not the same as the length of a demand interval setting. The former determines how often a data point is returned (eg, one data point for every 15 minute period) while the latter determines the length of the demand interval (eg, how many data points are included when calculating an average).
In other words, a single data point in a max demand export can be described as "the average peak demand over the past N minutes for the time period from XX:XX to YY:YY with a data point every Z minutes", where N is the "Length of a demand interval" setting, XX:XX is the starting time of the export, YY:YY is the ending time of the export, and Z is the export interval.
Example Data
In the example below, two data sets were obtained from the same meter. The first data set (columns A and B) is a minute-granular average value export. The second data set (columns G and H) is max demand data from the same period, with a 15 minute demand interval and a 15 minute export interval.
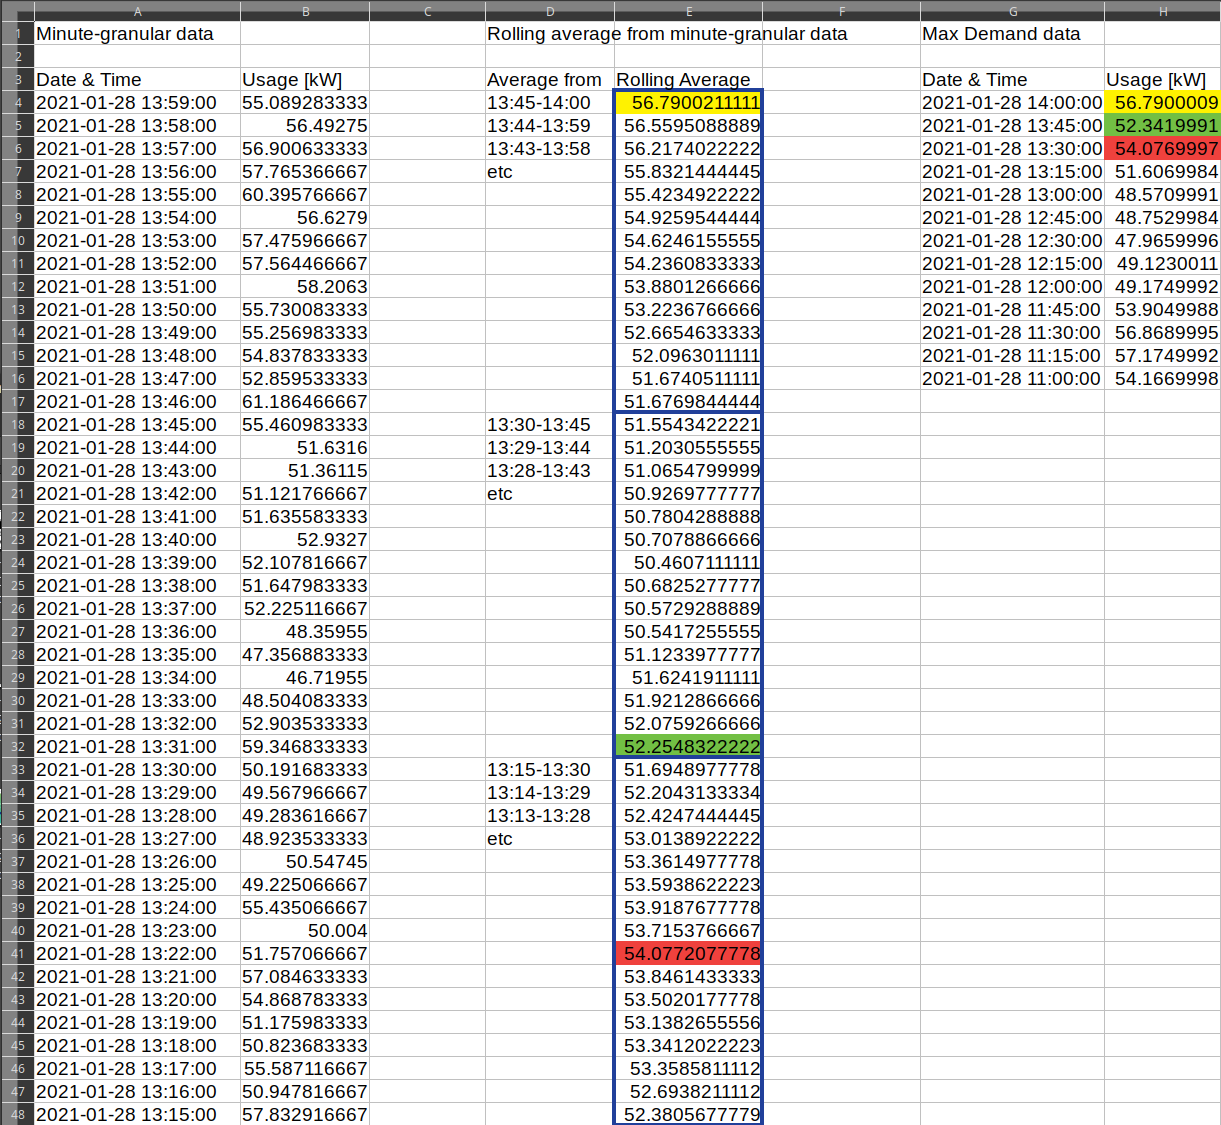
Column E contains a rolling 15 minute average calculated from the minute granular data in column B (the "Length of a demand interval" value). The blue outlines represent 15 minute intervals (the export interval value).
The colored values in column E are the highest value peak) for each 15 minute interval (one per blue box). They are color coded to tie to the same values in the max demand data (column H). Note that these aren't perfect matches - the process used by the eGauge is slightly different, so there will be small differences due to rounding and granularity.
Monetary registers
Overview
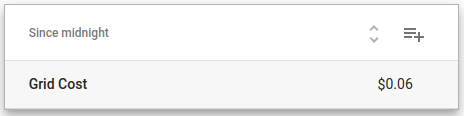
By default, the eGauge applies a flat rate cost per kWh used or generated to the summary areas at the top of the main graph page. In the example below, the site has used 24.7 kWh at a cost of $.13 per kWh, for a grand total of $3.21 of usage (values are rounded to the nearest cent).
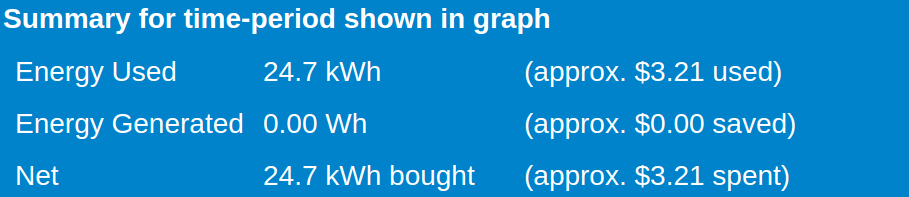
For Usage, the value entered in the "Average cost of 1kWh of electricity" under Settings -> Preferences is multiplied by the value of the "Usage" totaling register. For Generation, the value entered in the "Average REC-payment per kWh generated value is added to the "Average cost of 1kWh of electricity" value, and then multiplied by the value of the "Generation" totaling register.

This approach does not work for tiered billing systems (e.g., any billing system where the cost per kWh varies in response to the date, time, or month). However, it is possible to create monetary registers to accommodate these billing systems. Generally, one monetary register is required for Usage and one for Generation.
Creating a monetary register
Monetary registers are a special type of formula register. Formula registers are physical registers (that is, they occupy one register slot in the eGauge database) and are specified using the register type =. A monetary register uses the unit type Monetary [${currency}/s]. The register also features a formula field (empty in the example below).

As with all physical registers, a monetary register will only record values from the time it is created moving forward.
Creating a monetary register formula
It's strongly recommended to use a plain text editor (notepad, nano, vim, etc). Other software may add formatting characters which can cause issues.
At the most basic level, a monetary register multiplies the value of an arbitrary power register or set of power registers against one or more cost per kWh values. The monetary register is expressed in terms of currency units per second (eg, dollars, pounds, euros, etc). To convert from currency per kWh to currency per second, the final step of any monetary register calculation is to divide by 3.6e6 (or 3600000). Here's a basic example:
($"Grid"*.25)/3.6e6
This example would effectively be the same thing as setting the "Average cost of 1kWh of electricity" to .25, except you can use any arbitrary register in the calculation (meaning you're not limited to using the Usage totaling register). For example, you could add two registers together:
(($"Subpanel1"+$"Subpanel2")*.25)/3.6e6
or multiply by some additional value:
(($"Grid"*2)*.25)/3.6e6
Monetary register formulas can also utilize some of the built-in eGauge functions (specifically time(), wday(), mday(), and month()) for tiered billing structures. For more information on these functions, refer to the function documentation on your specific meter by appending /fundoc.html? to the end of your meter URL (for example, DEVNAME.d.egauge.net/fundoc.html? where DEVNAME is the device name of your meter).
Available functions will vary from meter to meter depending on meter firmware version. It may be necessary to update meter firmware to get access to certain functions.
On meters connecting to eGauge.io this information will be available at: DEVNAME.egauge.io/fundoc.html
Basic Examples
Let's start with a basic example - tiered billing with a higher peak rate between 5pm and 9pm.
Standard 12am to 5pm; 9pm to 12am - $.15 / kWh
Peak 5pm to 9pm - $.25 / kWh
The eGauge features a full variety of comparison operators (=, <, >, <=, >=), so we'll use those along with the time() function.
The time() function is based on the time zone set under Settings -> Date & Time
A comparison operator will return a 1 if true, or a 0 if false. Thus, we can use the following to test for the time range between 5pm and 9pm:
(time()>17)*(time()<21)
If both conditions are met, the result is 1*1. If either condition is false, the result is 0*1 or 1*0 (0 either way).
Next, we'll use a conditional to return a value based on the time comparisons (expressed as C ? T : F where C is the condition, T is the value returned if true, and F is the value returned if false).
Spaces in the formula are optional, and are ignored. In the examples below, spaces are used to improve readability.
((time()>17)*(time()<21) ? ($"Grid"*.25) : ($"Grid"*.15))/3.6e6
This is the complete formula - we'll get the value of the "Grid" register multiplied by .25 and divided by 3.6e6 if the time is between 5pm and 9pm, and the value of the "Grid" register multiplied by .15 and divided by 3.6e6 if the time is outside of that range.
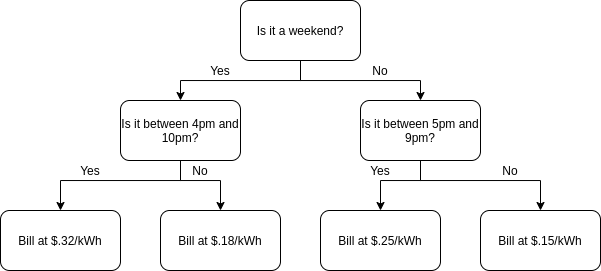
Intermediate Example
Moving on to a more complex example - it's possible to nest conditionals to perform more complex comparisons. Here's an example using time of day and day of week:
Peak - 5pm-9pm M-F $.25
Peak Weekend - 4pm-10pm S-S $.32
Off Peak - 12am - 5pm; 9pm-12am M-F $.15
Off Peak Weekend - 12am-4pm; 10pm-12am S-S $.18
((wday()<=4) ? ((time()>17)*(time()<21) ? ($"Grid"*.25) : ($"Grid"*.15)) : ((time()>16)*(time()<22) ? ($"Grid"*.32) : ($"Grid"*.18)))/3.6e6
Here, we've created a conditional which uses a comparison to see if wday()<=4 (corresponding to a weekday). If it is a weekday, the first nested conditional runs to check the time and return a value based on the time; if it's a weekend, the second conditional runs a different time check and returns a different value based on the time. Finally, we divide by 3.6e6 at the end, which is always required.
The following flowchart may better illustrate the logic behind this formula:
Formula registers have a finite length, meaning that extremely intricate billing schemes may not be supportable.
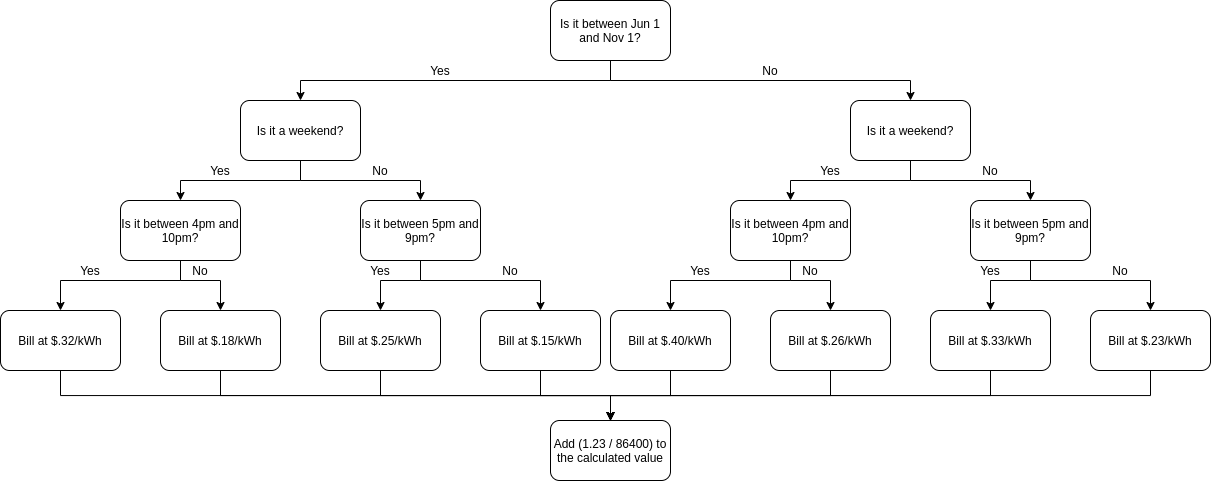
Advanced Example
Building off of the previous example, let's say the utility also has an additional per-kWh charge from November thru May, and an additional flat daily rate:
Peak - 5pm-9pm M-F $.25
Peak Weekend - 4pm-10pm S-S $.32
Off Peak - 12am - 5pm; 9pm-12am M-F $.15
Off Peak Weekend - 12am-4pm; 10pm-12am S-S $.18
Winter Peak Charge - Nov-May, $.08 per kWh
Daily surcharge of $1.23
((((month()<10)*(month()>4)) ? ((wday()<=4) ? ((time()>17)*(time()<21) ? ($"Grid"*.25) : ($"Grid"*.15)) : ((time()>16)*(time()<22) ? ($"Grid"*.32) : ($"Grid"*.18))) : ((wday()<=4) ? ((time()>17)*(time()<21) ? ($"Grid"*.33) : ($"Grid"*.23)) : ((time()>16)*(time()<22) ? ($"Grid"*.40) : ($"Grid"*.26))))+(1.23/86400))/3.6e6
We're building off of the previous formula in this example. We've used another conditional to test for the month of the year - if the month is > 4 (i.e., June 1) or < 10 (i.e., Nov 1) the meter uses the original formula in the Intermediate Example. If the month isn't within that range, the meter uses a modified version of the formula in the Intermediate Example (with rates adjusted upward by $.08 per kWh).
Once a cost per kWh value is calculated, we take the calculated value multiplied by the actual register measurement and add 1.23/86400. We have a daily charge of $1.23, but the monetary value register expects dollars per second, not dollars per day. To convert $/s to $/d, we can divide by the number of seconds in a day (86400).
The following flowchart may better illustrate the logic behind this formula:
Using the monetary register
Once a monetary register has been created and saved, navigate back to Settings -> Preferences. Scroll down to "Money used register" or "Money earned register" (based on whether the monetary register is used for consumption or generation billing) and select the appropriate register from the dropdown menu.
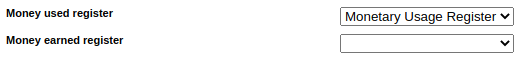
Make sure to click "Save" at the bottom of the page to apply these changes.
It's also possible to view the cumulative total (i.e., cost) recorded by a monetary register by displaying that register in the Mobile-Friendly Dashboard UI. To do this, create a new "Summary Table" dashlet (or add a new register to an existing dashlet). Leave the Type as "Register value", name the dashlet as desired, select the monetary register in the "Register to display" field, and leave the unit as "auto". It may be necessary to flip the polarity of the reading to get a positive dollar value (using the "Flip sign of the value" option). This should result in something similar to the following:
Lua Scripting
Lua Scripting Overview
Lua scripting is an advanced topic. eGauge Support cannot review code and has limited support for troubleshooting Lua scripts.
Introduction
Support for eGauge Script (eScript) was introduced in firmware v1.1, allowing limited scripting through the use of formula registers. eScript was designed for calculating basic and common mathematical formulas such basic arithmetic operations, comparisons, and conditionals, along with the ability to call library routines (functions).
Firmware v4.1 introduced Lua v5.3 support. To ensure safe operation, Lua execution is guarded with timeouts to protect against infinite loops or unacceptably long execution times. Additionally, a restricted set of standard libraries is supported.
To maintain backwards compatibility, firmware transparently translates eScript expressions to Lua scripts before execution and the Lua execution environment provides all the functions available within eScript.
Lua Primer
Lexical Conventions
Names may consist of any letters, digits, or underscores but may not start with a digit. Numeric values use the same conventions as in most other languages, including the ability to write hexadecimal values with a prefix of 0x. The two boolean literal values are true and false. A variable with an undefined value is nil. Strings may be enclosed in double or single quotes. Characters within a string may be escaped with a backslash. Comments start with a double-dash (--) and extend to the end of the line. Statements may be terminated with a semicolon but, generally, semicolons are not required (even when there are multiple statements on a single line). The only exception to this rule is that a semicolon is required if the following statement starts with a left parenthesis.
Variables
Variables are global unless explicitly declared as local. For example:
x = 10        -- global variable
local y = 42   -- local variable
Operators
Lua provides a normal set of operators for arithmetic operations and comparisons. A bit unusual is that the inequality operator is ~= rather than the more typical !=. Logical operators use keywords like in Python: and, or, and not. The length of a string or a table (see Structured Data) is obtained by prefixing the string or table name with a hash mark. #'hi' would return 2, for example. Strings can be concatenated with the double-dot operator. 'yell'..'ow' would yield 'yellow', for example.
Control Structures
The syntax for the various control structures is:
for index=initial,step,final do block end -- numeric for loopfor var in iterator do block end -- iterator for loopwhile cond do block end -- while looprepeat block until cond -- do while loopif cond then block else block end -- conditional statementYou can use break to exit a loop but, unlike in C and other languages, there is no continue that would allow you to skip to the next iteration.
Structured Data
Lua uses tables to represent both arrays and hash tables (Python dictionaries, Javascript objects). For example:
local a = {'a', 'b', 'c'}assigns an array containing the strings 'a', 'b', and 'c' to local variable a. Unlike in most other languages, the array base index is 1, so a[1] would yield the first element or 'a' in our example.
Dictionary literal values can be written like this:
local d = {['k1']='v1', ['k2']='v2'}and indexed with square brackets such that d['k2'] would yield 'v2', for example. If the keys for a dictionary happen to be valid Lua names, the square brackets and quotes around the key strings can be omitted. For example, the above example could be simplified to:
local d = {k1='v1', k2='v2'}For such key values, it is also possible to access their values using member-name syntax. For example, d.k1 would yield 'v1', just as d['k1'] would.
Migrating from eScript to Lua
Most of eScript has a direct equivalent in Lua. eScript has full support for a single numeric type (IEEE754 double precision float) and limited support for strings. As configured for the eGauge firmware, Lua has the same numeric type but also supports 32-bit integers and has full support for strings, boolean values, and tables.
The most important differences between eScript and Lua are as follows:
-
In eScript, the value of a register is obtained with $"register_name", whereas in Lua, the equivalent expression is __r("register_name").
-
Lua boolean values cannot directly be used as numeric values, whereas eScript uses 0 to represent false and any non-zero value for true.
-
Lua does not provide a direct analog for the conditional operator
cond ? if_true_expr : if_false_exprInstead, Lua uses the logical expression
cond and if_true_expr or if_false_exprThis works quite similarly to the eScript conditional because of the way the and and or operators are defined. Specifically, and returns false if the left-hand side is nil or false or the right-hand side's value otherwise. Operator or returns the value of the left-hand side if it is not nil or false and the value of the right-hand side otherwise. Both operators short-circuit evaluation and operator and has higher precedence than or.
-
eScript automatically propagates NaN (Not-a-Number) values. For example, if any function is called with a NaN value, the returned result is also NaN. Similarly, if the condition of the conditional operator is NaN, then the result of the conditional expression is also NaN.
Given the similarities between eScript and Lua, most eScript expressions trivially translate to Lua. The non-trivial translations are shown in the table below:
In words, the comparison operators get translated to calls to helper functions __lt(), __le() and so on. These helper functions check if either a or b is a NaN and return NaN, if so. If not, they perform the comparison and return 0 for false and 1 for true. The translation of the conditional operator is more complicated because care has to be taken to handle NaN properly and to evaluate a and b only when necessary. This is accomplished in Lua with the help of an anonymous inline function which checks whether the condition is NaN and returns NaN if that is the case. Otherwise, the function checks if the condition has a non-zero value and, if so, returns the value of a. Otherwise, it returns the value of b.
Lua Environment provided by eGauge Firmware
Standard Environment
For safety reasons, the eGauge firmware provides a restricted Lua environment (the Lua sandbox). Basic functions and variables are limited to the following subset (see Lua 5.3 manual for a detailed description):
_VERSION, assert, error, getmetatable, ipairs, load, next, pairs, pcall, print, rawequal, rawget, rawlen, rawset, select, setmetatable, tonumber, tostring, type, xpcall
The following standard Lua libraries are available:
Additions Provided by eGauge Firmware
Basic and Alert functions
All functions available to eScript are also available to Lua scripts. See the online documentation of an eGauge meter for a complete list (Help → Basic functions or Help → Alert functions). When these functions are called from Lua, they will also propagate NaN values, just like for eScript. That is, if any of the functions are called with a NaN argument, the return value will also be NaN.
Module json
This module provides the ability to encode a Lua object to a string and safely convert a string back to an object again.
string = json.encode(value):
This function accepts a Lua value and serializes it to the corresponding JSON string, which it returns. Tables that contain cyclical references cannot be JSON-encoded and will result in an error. The maximum size of the JSON-encoded string is currently limited to 4095 bytes. Lua tables may be indexed by a mix of number, boolean, and string values, whereas JSON objects are always indexed by strings. This function converts Lua tables that are not empty and whose indices consist entirely of numbers in the range from 1 to N (where N is the length of the table) to JSON arrays and everything else to JSON objects. In the latter case, numeric and boolean indices are converted to their equivalent strings.
value = json.decode(string):
This function accepts a string and deserializes it to the corresponding Lua object. Only double-quotes are allowed for string quoting. White space consisting of blanks or tabs is ignored.
Module persistent
This module provides variables whose values persist across power outages and device restarts.
obj = persistent:new(name, initial, description):
Declares a persistent variable with the specified name. Unlike Lua names, this name can be an arbitrary string. The name must be unique as any Lua script declaring a persistent variable of the same name will access the same underlying object. If this is the first time the persistent variable has been declared, its value is set to initial. The purpose of the variable must be described by the string passed for description. The return value is an object representing the persistent variable.
obj:get()
Returns the current value of the persistent variable represented by object obj.
obj:set(value)
Sets the value of the persistent variable represented by object obj to value. Any value acceptable to json.encode() may be set.
Lua Environment for Control Scripts
Control scripts have access to the standard environment available as described in the previous section. They also have access to all basic and alert functions as well as to the coroutine library. Several low-level functions as well as several convenience modules are available as well, as described below.
Low-level Functions
Most of these functions are normally not used directly. They provide the low-level mechanisms required to implement the higher-level abstractions provided by the modules described in the sections below.
tid, err = __ctrl_submit(attrs, method, args…)
Submit a call to the method named method on the device identified by attrs, passing arguments args. The method name must be a string, attrs a table of name/value pairs, and args must be a sequence of zero or more Lua argument values that are compatible with the argument types expected by the named method. The method name may be a fully qualified method name consisting of an interface name, immediately followed by a dot (.), immediately followed by the proper method name or a proper method name on its own. In the latter case, the method is invoked through the first interface registered for the device that implements the named method. Otherwise, the method is invoked through the named interface.
__ctrl_submit returns two values: a transaction id tid and an error string err. On success, tid is a non-negative number which uniquely identifies the newly created call object and err is nil. On error, tid is a negative error code (see ctrl.Error below) and err is an optional string that may provide an explanation of why the call failed. The error string, if provided, is typically translated to the locale set on the meter.
status, result = __ctrl_result(tid):
Get the result for the method call identified by transaction id tid. The tid must be non-negative and must have been returned by a previous call to __ctrl_submit.
__ctrl_result returns two values: an integer status and result. The status is zero on success, in which case result is the result returned by the method call, converted to a Lua value. On error, status is a negative error code (see ctrl.Error below) and result is nil. In particular, if a method call is still in progress, error code ctrl.Error.AGAIN (-8) is returned. In this case, the caller should wait for a little bit and then retry the __ctrl_result call again until it succeeds.
status, err = __ctrl_cancel(tid):
Attempt to cancel the method call identified by transaction id tid. This tid must be non-negative and must have been returned by a previous call to __ctrl_submit.
__ctrl_cancel returns two values: an integer status and an optional error string err. The status is zero on success, in which case tid is guaranteed to be an invalid transaction id, until it is reused and returned by another call to __ctrl_submit. On error, status is a negative error code (see ctrl.Error below) and err is an optional string that may provide an explanation of why the call failed. The error string, if provided, is typically translated to the locale set on the meter.
ret, err = __ctrl_get_devices(attrs):
Get a list of devices that match the optional attributes specified by table attrs. If the attrs is omitted or nil, a list of all known (registered) devices is returned.
__ctrl_get_devices returns two values: table ret and an optional error string err. On success, ret is a list of tables and err is nil. Each table in the returned list corresponds to a matching device in no particular order. The table contains the name/value pairs registered for that device.
On error, ret is nil and err may be a non-nil string explaining what went wrong, typically translated to the locale set on the meter.
ret = __ctrl_get_interface(name):
Get a particular interface or a list of all known interfaces. Argument name must be a string that names the desired interface or omitted or nil to get a list of all interfaces.
__ctrl_get_interface returns a single value ret. If there was an error or if the requested interface cannot be found, nil is returned. Otherwise, ret is a single interface (if name was specified) or a list of interfaces (if name was omitted or nil). Each interface is described by a table with the following members:
-
name: The name of the interface as a string.
-
methods: A list of methods implemented by the interface.
Each method is described by a table with the following members:
-
name: The name of the method as a string.
-
arg_types: The DBus type signature of the arguments as a string.
-
ret_type: The DBus type signature of the return value as a string.
-
doc: A description of what the method does as a string. This string may contain references to the arguments which are enclosed in <arg>/</arg> tags. For example, the string "<arg>foo</arg>" would refer to the method argument named "foo".
-
arg_names: A string of comma-separated argument names, in order of appearance. This is used only for documentation purposes as, other than in the doc string, the argument names have no significance. For example, the string "foo,bar" would indicate that the method expects two arguments, which are referred to in the doc string as argument names foo and bar, respectively.
ret = __sleep(time):
Suspend execution of the call for time seconds. The specified time may be a fractional amount, not just an integer amount. If the Lua program calling __sleep has other runnable coroutines, the other coroutines are executed. If there are no runnable coroutines left, execution of the program is suspended for the minimum amount of time required until the first coroutine becomes runnable again.
The function returns an integer ret which is zero on success or negative if an error occurred.
ret = sleep(time):
This is an alias for __sleep and may be used by end-user Lua programs as a convenience. Libraries should always call __sleep instead to ensure the intended function is executed even if a Lua program redefines the name sleep to another value.
Module ctrl
This module provides a higher-level interface to invoke control methods. It is generally preferable to use this module rather than the low-level functions documented by the previous section.
dev = ctrl:dev(attrs, obj):
Create a control device object with attributes attrs. The optional obj argument could be specified to implement an extended control device class, but is usually omitted (or you could pass nil to it) to create a new object. This operation does not communicate with the remote device identified by attrs and therefore returns immediately.
iface = dev:interface(name):
Create an interface object for the interface identified by name of device dev. The returned interface object will contain a proxy method for each method defined by the named interface. The proxy methods can be called like any other method and automatically forward the call to the control device and then wait for the result to become available from the device. As such, these operations can take a long time to complete and will call __sleep() as needed. Because of this, other coroutines may be executed while a proxy method call is in progress.
status, result = dev:call(method, args…)
Call the method named method on device dev, passing arguments args to it and return the result. The method name must be a string and args must be a sequence of zero or more Lua argument values that are compatible with the argument types expected by the named method. The method name may be a fully qualified method name consisting of an interface name, immediately followed by a dot (.), immediately followed by the proper method name or a proper method name on its own. In the latter case, the method is invoked through the first interface registered for the device that implements the named method. Otherwise, the method is invoked through the named interface.
Two values are returned: an integer status and result. The status is zero on success, in which case result is the result returned by the named method, converted to a Lua value. On error, status is a negative error code (see ctrl.Error below) and result is nil.
Error:
This table declares symbolic names for various control errors, namely:
-
UNSPEC (-1): An unspecified error occurred.
-
INVAL (-2): An invalid or incompatible argument was passed to a method.
-
NODEV (-3): The device attributes specified an invalid device path.
-
ATTRS (-4): The attributes do not match the selected device.
-
NOMETHOD (-5): The method name could not be found.
-
NOENT (-6): The specified transaction id could not be found.
-
BUSY (-7): The device is busy (too many pending calls).
-
AGAIN (-8): The call is still pending.
Module tasks
This module provides a convenient interface for creating several tasks that may be run quasi concurrently and then executing them until they have all completed.
tasks:add(fun, args…):
Add a task which, when executed, runs function fun with arguments args until the function returns. The function may call __sleep or coroutine.yield to suspend execution temporarily and give other tasks a chance to execute.
tasks:run():
Execute previously added tasks until they have all completed.
Creating and Using Lua scripts
Lua scripting is an advanced topic. eGauge Support has limited support for troubleshooting Lua scripts and cannot review Lua code.
Use caution and test extensively when using Lua scripts for automated control of remote devices to prevent unexpected operation or damage to connected equipment.
Use the latest firmware: Lua support was added in eGauge meter firmware version 4.1. However, bug fixes and new features this article refers to may have been added in newer firmware versions. Click here for information about checking and updating a meter's firmware.
Introduction
eGage meters have a Lua scripting environment that allows for creation of advanced formula register and alert functions, as well as automated control of supported devices such as the eGauge PRM3 Power Relay Module.
Refer to the Lua Scripting Overview article for a general Lua primer and additional modules provided by the eGauge firmware.
Lua scripting interface
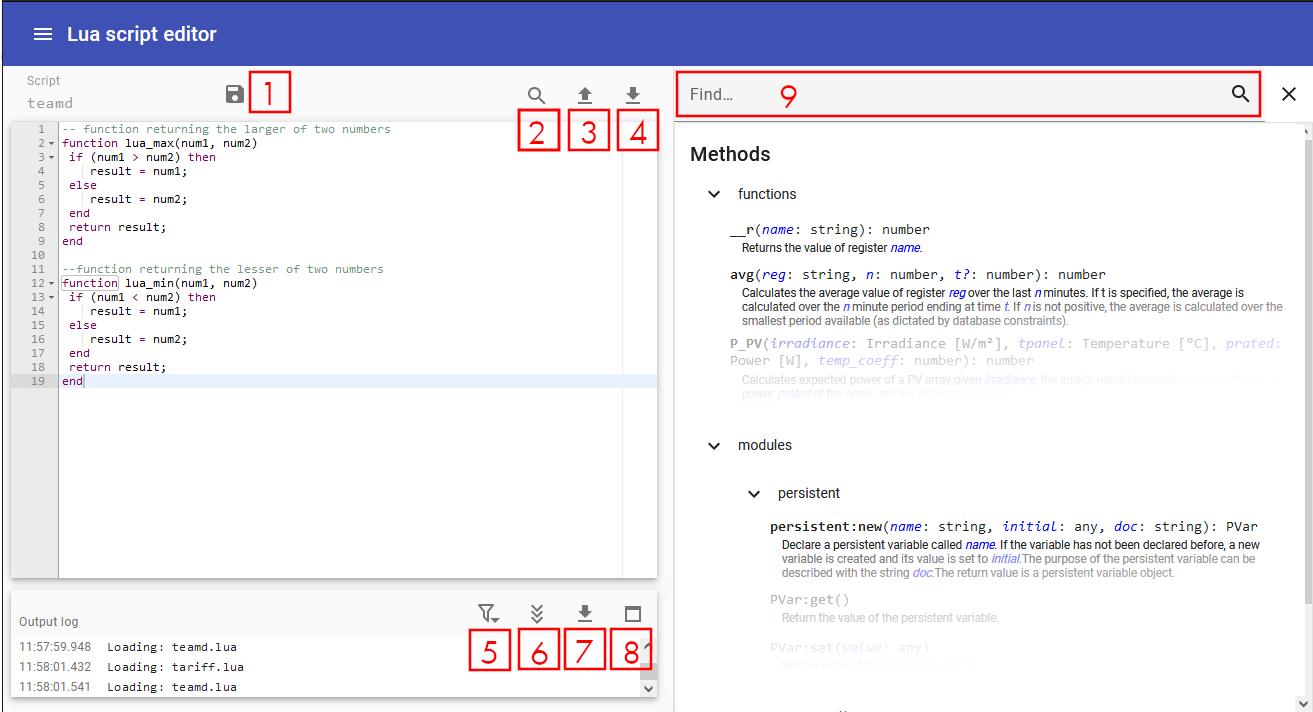
Several keyboard shortcuts are displayed when the interface is loaded:
-
F1: Open the keyboard shortcuts menu -
F2: Toggle the sidebar on the right -
Ctrl-␣: Toggle auto-complete -
Ctrl-,: Open the GUI settings menu
When using Mac, use the ⌘ key instead of Ctrl.
The eGauge web interface has a built-in Lua script editor with 3 panes as shown in the above screenshot.
-
Editor (top left)— The Lua code editor. There are 4 buttons for this pane:
- [1] Save: This saves the functions and makes them available for use by the meter.
- [2] Search: This allows to search for and replace text in the code.
- [3] Upload: This replaces the current script on the meter with a file upload.
- [4] Download: This downloads the current script from the meter as a file
-
Output log (bottom left)— Below the editor, the Lua log is displayed.
This will include any script errors or print statements. If there are no
custom Lua functions for the script loaded, there may be an error such as
"Lua error: cannot open xxx.lua: No such file or directory", and this error may be
ignored. There are 4 buttons available for this pane:
- [5] Filter: Apply a filter to only output log lines containing certain text
- [6] Autoscroll: Toggles auto-scrolling to the most recent log output
- [7] Download: Downloads the log file
- [8] Maximize Window: Maximizes the log output window
- Sidebar (right)— the sidebar on the right-hand side provides a method explorer to find and describe all available eGauge-provided functions and modules. The function or module may be clikced on to automatically insert it into the Editor pane to the left. The sidebar has a search bar [9] to conveniently search through methods, functions and documentation
Accessing the Lua scripting environment
- If using the classic interface, click on View → Modern user-interface:


Script Types
Click to expand information for the script type:
Formulas script (formula registers)
Creating lua functions in the Formulas script editor will allow the functions to be used in a formula register.For example, here are two functions made in the Lua Formulas script editor that will return the min or max of two numbers:
-- function returning the larger of two numbers
function lua_max(num1, num2)
 if (num1 > num2) then
    result = num1;
 else
    result = num2;
 end
 return result;
end

--function returning the lesser of two numbers
function lua_min(num1, num2)
 if (num1 < num2) then
    result = num1;
 else
    result = num2;
 end
 return result;
end
They may then be used in a formula register:

And we may see the registers work as defined by the script functions:
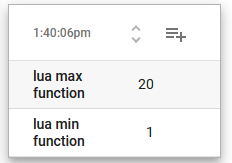
Tariff script (Advanced time-of-use and tiered billing)
Advanced time-of-use and tiered billing may be performed in this Lua scrript.A tariff script should provide (at least) a cost(register, negate, schedule) function which calculates the incremental cost based on the energy-use recorded by register. negate can be set to true if the register's value counts down for power consumption. schedule is optional and can be set to the (non-default) name of the schedule to use when calculating the cost.
A formula register of type "monetary" would be used with the cost()
function.
For an example billing script, from the classic interface:
- Navigate to Settings → Billing.
- Choose Xcel Colorado as the tariff provider.
- Click "OK" to save and go back to the main settings page.
- Go back to Settings → Billing.
- Change the tariff providert to "custom"
- Click the "Customize tariff script" button, which will open a copy of the Xcel Colorado billing tariff in the Lua script editor.
Alert script
Alerts scripts work the same as Formula scripts, but are used in eGauge meter alerts, configured in Settings → Alerts.Control scripts
See the main Lua Scripting Overview Control Scripts section for additional Lua Control environment information.
There is risk of damaging external equipment using control scripts. Only skilled Lua developers familiar with the eGauge meter and software should attempt to use Lua control scripts.
Control scripts can be used to confrol supported equipment such as the eGauge Power Relay Module (PRM3).
For example, the following script reads the instantaneous value of a register called "Temperature" and controls a PRM3 relay contact. If the temperature is lower than 21 C, relay number 0 of the PRM3 is closed (activated), otherwise opens (turns off) relay number 0. It then sleeps for 15 minutes before checking again.
In the real world, the control script should be more advanced
dev = ctrl:dev({interface='relay'})
  relay = dev:interface('relay')

  while true do
    print("Temperature is currently: " .. __r("Temperature"))
    if __r("Temperature") < 21 then
        relay:close(0)
    else
        relay:open(0)
    end
    sleep(60*15)
  end
Persistent variables
See the main Lua Scripting Overview section on Persistent variables.
Persistent variables are variables that are preserved between reboots or power cycles.
The following Formula script creates and updates a peristent variables with a given name and number passed to it in a formula register, and prints debug to the output log:
function persistent_variable_example(name, number)

     obj = persistent:new(name, number, "Variable stored by formula function persistent_variable_example")

     current_value = obj:get()
     print(name .. " currently has value " .. current_value)

     print("updating " .. name .. "to new value " .. number)

     obj:set(number)
  end
A register is configured to run the formula script:

This creates or updates a persistent variable called "variable test 1" with the current time.
The Formula script editor shows the print debug as the variable is updated once a second as the formula register is run:
15:26:28.168 variable test 1 currently has value 22.043333333333
15:26:28.168 updating variable test 1 to new value 22.043611111111
15:26:29.171 variable test 1 currently has value 22.043611111111
15:26:29.172 updating variable test 1 to new value 22.043888888889
15:26:30.168 variable test 1 currently has value 22.043888888889
15:26:30.168 updating variable test 1 to new value 22.044166666667
15:26:31.168 variable test 1 currently has value 22.044166666667
15:26:31.168 updating variable test 1 to new value 22.044444444444
While this particular example is rather pointless, persistent variables may be used in any Lua scripts. Control scripts are executed continuously, and a formula register would not need to be created to run it.
Chart Functions
Editing chart functions is an advanced feature which requires knowledge of JavaScript. eGauge support cannot assist in writing or debugging JavaScript code.
Chart functions allow for the use of JavaScript to calculate new values based on the data recorded in the registers in the meter configuration.
Creating or editing a Chart function
The Chart Function editor can be accessed from the main menu by choosing Chart → Edit functions
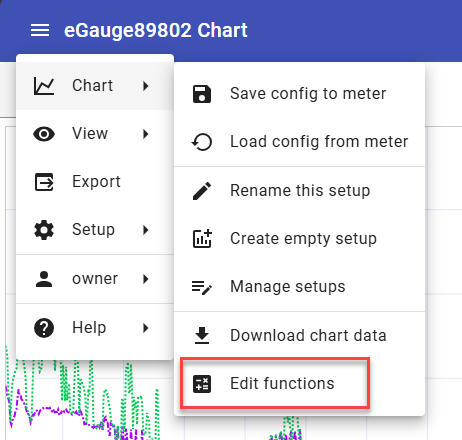
Click on an existing chart function to edit it or click on the Add function icon to add a new one. Click the X to delete an existing chart function:
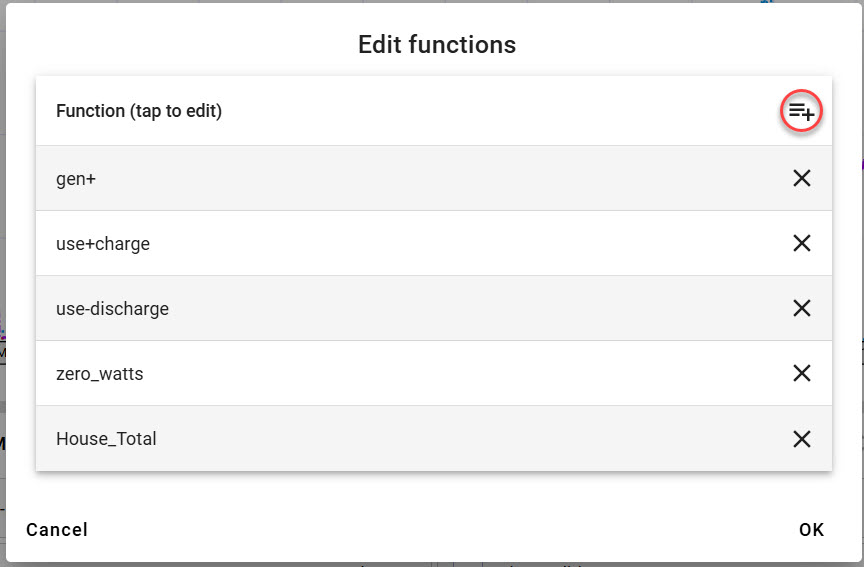
The Chart function editor is shown below with an example function:
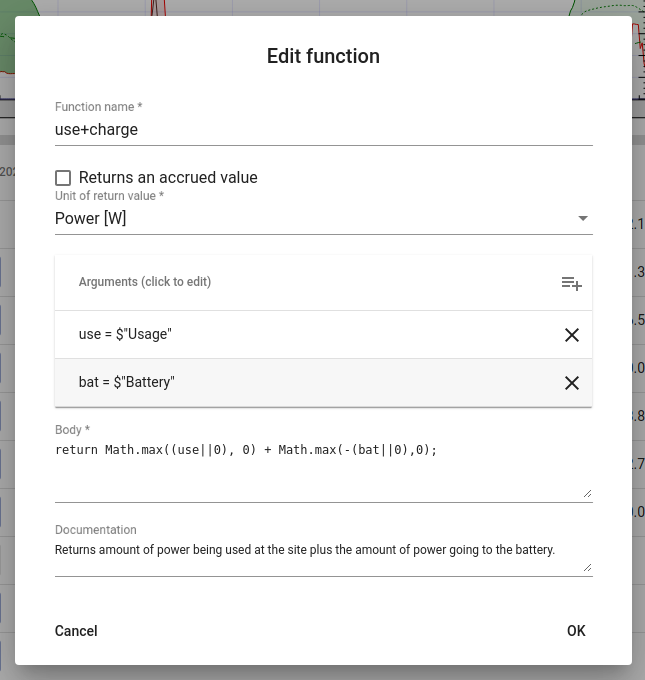
Function name - (mandatory field) An arbitrary, unique name selected by the user. This is only used within the eGauge chart and does not need to be a valid JavaScript function name. In the example script shown above, the Function name is use+charge
Returns an accrued value - Enable this option to return an accrued (cumulative) value. Leave this option disabled to return an instantaneous value.
Unit of return value - (mandatory field) Selects the unit the value returned by the function displays as. In the example script above, this is set to Watts. This value should be changed depending on the unit of the calculation being performed by the function.
Arguments - This table defines the list of values to be passed to the function. Only register values can be passed as arguments. Argument names must be valid JavaScript identifiers.
In the example script shown above there are two arguments defined. use which is being passed the instantaneous value of the eGauge Usage Virtual register (defined as $"Usage") and bat which is being passed the instantaneous value of the "Battery" Virtual register (defined as $"Battery"). Both "Usage" and "Battery" are register values defined in the eGauge Installation settings (link) of the meter.
Body - This section defines the calculations to be performed by the function.
In the example above, the body calculates the sum of how much power is being used at the site plus how much power is going into the battery to charge it.
If a function argument refers to a register that no longer exists in the meter configuration settings, its value will be Undefined. This is the reason for using "||0" in the code above: it ensures that if either the usage or battery virtual registers are undefined, a value of 0 is used instead.
Note that the body may be an arbitrary JavaScript function body and does allow for nested functions. Example:
function reg_or_zero(reg) {

  return reg || 0;

}

return reg_or_zero(use);
Documentation - A field for adding a description of what the function does
Click 'OK' to save your chart function.
Graphing Chart functions
Saved chart functions will appear in the list of values to graph after register values. To add a saved chart function to a chart, add a new chart item and choose the chart function from the list of items displayed in the Value to Graph dropdown list. The chart function will behave as any other chart item.